Contents

- What is Google Analytics 4?
- Should I switch to Google Analytics 4?
- What's Changed - Universal Analytics Vs. Google Analytics 4
- How to set up Google Analytics 4
- Views and Data Streams in Google Analytics 4
- Google Analytics 4 Dashboard Overview
- Reports Snapshot in Google Analytics 4
- Real-Time Overview report in Google Analytics 4
- Life Cycle reports in GA4
- Acquisition reports in Google Analytics 4
- Engagement Reports in GA4
- Monetisation Reports in Google Analytics 4
- E-commerce purchases
- Retention Report in Google Analytics 4
- Demographic Reports in GA4
- Tech Reports in Google Analytics 4
- Library
- Building Comparisons in Google Analytics 4
- Event Tracking in Google Analytics 4
- Google Tag Manager Events in GA4
- How to set up GTM events in GA4
- Get more from your events with custom definitions
- How to configure and track conversions in Google Analytics 4
- Creating Custom Reports in Google Analytics 4
- Segments in Google Analytics 4
- A summary of the changes in Google Analytics 4

Get Weekly Marketing Tips
Join 30,000+ marketers and get the best marketing tips every week in your inbox
Love it or hate it, Google Analytics 4 is here to stay.
Google has decided to move towards a more customisable analytics platform which helps to combine website and app data, as well as giving you more control over the data that you see.
It gives you the opportunity to focus more on data that matters to your business, rather than standardised data that’s trying to cater to every business type.
There’s lots of new terms in Google Analytics 4 (GA4), different types of reporting, and everything is an event (a slight exaggeration, but it’s not far off)
Already set up Google Analytics 4 but struggling to know where to start? Check out this video to learn where the most important metrics are, and how to include them in explorations (custom reports).
Struggling to make sense of Google Analytics 4?
Get all the heap you need (and turn the data into revenue-increasing insights) with our free guide.

What is Google Analytics 4?
Google Analytics 4 is going to replace Universal Analytics (UA) in 2023, and is a new way of collecting and reporting on data.
According to Google, it has several advantages over Google’s Universal Analytics, which is the current standard.
Should I switch to Google Analytics 4?
We recommend setting up a Google Analytics 4 property as soon as possible regardless as to whether you intend to use it right away, as this new Google Analytics 4 property won’t be using any retrospective data from Universal Analytics.
You don’t want to miss out on data you could be gathering now when they force you to make that switch, even if you don’t intend on using Google Analytics 4 until 2023.
It’s also quite different to Universal Analytics, so it’s better that you get practice now before you have to make the switch.
What’s Changed – Universal Analytics Vs. Google Analytics 4
Looking at of the changes and challenges UA users have faced when moving to GA4, some common issues we found were:
- Understanding which metrics to use/look at compared to Universal Analytics
- Understanding ‘events’ in GA4
- Trouble integrating with Google Ads or Search Console inside the platform
- Difficulties tracking conversion data
- Trouble finding assisted conversions and bounce rate
These are just a few of the changes we noticed, but hopefully they make you feel less alone if you’re struggling with GA4.
Moving to a new platform can be difficult, especially if you’ve been using Universal Analytics for years, or just got to grips with it and now you’re having to make the change to this new way of collecting analytics.
So what are we losing when we move to Google Analytics 4?
- No views
- No / limited IP filtering
- Missing reports that need to be set up manually
- Limits on custom dimensions
- No recurring email reports
That said, here is everything you will gain by moving to Google Analytics 4:
- Simplified data which is more accessible to users and the Google algorithm
- Better tracking across website and apps
- Codeless event tracking
- Custom reports
- AI-powered insights and predictions
- Advanced audience integration with Google Ads
- More focus on customer lifecycle-framed reporting
Many of these elements will help us gather data in a cookie-less future.
Now, let’s have a look at how to get GA4 set up. If you’ve already set up your Google Analytics 4 Property you can skip to the next section.
Is your marketing underperforming?
Request a free website and marketing review and our team will tell you how to improve your marketing.

How to set up Google Analytics 4
Setting up Google Analytics 4 is fairly straightforward, although you may need to speak to your web developer.
Step 1. Head to the admin section of your Google Analytics account

Screenshot of the Universal Analytics admin screen
Step 2. Look at the number of columns
If you can see Account, Property and View, you’re using Universal Analytics
If you just have Account and Property, you’re already using Google Analytics 4 and won’t need to make the switch.

The Account and Property columns in Google Analytics 4
Step 3. Select “GA4 Setup Assistant”
You can find this in the Property column on your admin screen.

Screenshot of where the GA4 setup assistant is located
Step 4. Choose from the two options – Get Started or Connect Properties
Get Started is what most people will use, as they likely don’t have an existing GA4 Property set up.
If you did somehow set up a GA4 Property that isn’t connected to your existing Google Analytics account, you can select “Connect Properties” and follow the walk through there.

Google Analytics 4 set up options
Step 5. Select your tag type

The Google Analytics 4 Setup Wizard
Depending on whether you prefer to use Google Tag Manager or Global Site Tag (gtag.js), your options will be slightly different here.
If you have the alert at the bottom as seen in the screenshot above, you’ll need to install new tags on your site to use GA4. You can do this using Google Tag Manager.
If you use gtag.js, you’ll be able to select “enable data collection using your existing tags”.
If you’re unsure as to which applies to you, the “enable data collection using your existing tags” checkbox will be inaccessible if you use Google Tag Manager rather than gtag.js, so you can’t accidentally check it if you’re not using gtag.js.
If you’re unsure, speak to your web developer (or ours) and they’ll be able to help you out.
Get to the top of Google
Learn how to get your website to the very top of Google (and turn that traffic into revenue).

Step 6. Explore and set up your GA4 property

Google Analytics property Setup Assistant connected screen
You’ll now be greeted with this screen, and you can click “See your GA4 property” to head over to your Google Analytics 4 property to set it up further.

Google Analytics 4 Setup Assistant page in GA4
Step 7. Set up the new tracking tag
First thing to do is to set up the new tag on your website.
Start by clicking “Tag Installation”, which will take you to the “Data Streams” page. Here, you can set up data streams from your website, as well as your iOS or Android Apps.

Google Analytics 4 Data Streams
The setup assistant will have already set up a data stream for you.
Click this data stream, and the “Web Stream Details” tab will open up. Here, you want to copy your Measurement ID, which is in the top right corner of this tab. If you’re used to Universal Analytics, this is like the tracking ID you may have used there.

Google Analytics 4 Measurement ID
Once you’ve copied your Measurement ID, head over to Google Tag Manager.
Select “Tags” in the menu and click “New” to create a new tag.

Add a new tag in Google Tag Manager
Give the tag a name, we’d suggest calling it “GA4”, and then select “Tag Configuration”.

Google Analytics 4 Tag Configuration
For the “tag type”, select “Google Analytics: GA4 Configuration”.
Now paste your Measurement ID into the box.

Paste your Measurement ID into the Tag
Next, click the “Trigger” box, and select “All Pages” so that the tag is installed on every page of your website.

Set up a trigger for your tag in GA4
One you’ve set up this trigger, hit save on your tag.
To test that it has been set up correctly, click “Preview” in the top right corner of the screen, which will take you to the Google Tag Assistant tool.
Put your website’s URL in the box and press connect.

Google Tag Assistant
This will open up another window which has your website in debug mode. You will get a confirmation in the bottom right corner to let you know that your website has been connected to Google Tag Assistant.

Google Tag Assistant connection confirmation
Minimise this window and head back to Google Tag Assistant. Click “continue” on the popup box, and see if your GA4 Tag has fired. If it says that it fired once, it’s working.

GA4 Tag fired once
Once you’ve checked this, head back to Google Tag Manager and click “submit” to save the changes.
Now your new tracking tab has been installed.
Head back to the GA4 Setup page and take a look at the other items that can be set up.
Some of the things you can do here are:
- Configure Custom Events
- Configure User IDs
- Configure Enhanced Measurements
- Activate Google Signals
- Link to Google Ads
- Define Audiences
- Import or set up Conversions
Take a look and set up the things that matter to your business. You may want to read the rest of this article before setting up some of these as they can be quite different in Google Analytics 4.
If you’d prefer to follow this setup in video form, check out the video below.
Struggling to get all your marketing done?
Download our marketing priority planner and get your marketing back on track.

Views and Data Streams in Google Analytics 4
Views, where you see your data and reports in UA, no longer exist in GA4.
This may change in the future, but the name of the replacement is Data Streams. There are currently less options for filtering to include or exclude certain data from your reports at this stage, as you do this in your custom reports.
What is useful, however, is the ability to see all your data in one place, no matter if it’s from your website or your app. You can set up multiple data streams to see website and app data in one property, rather than needing to switch back and forth between properties.
Even if this isn’t relevant to you right now, you may end up with an app for your business in the future.
As GA4 develops, there may also be the potential to connect with other pieces of tech, such as your point of service system or future technology developments.
Google Analytics 4 Dashboard Overview
This is the screen you’ll see when you open up GA4. It has a couple of top level bits of data, with some shortcuts based on your previous visits to GA4.

Screenshot of the GA4 Home tab
- Overview, which shows you the number of users and new users over a given time period, along with average engagement time and total revenue.

Overview of traffic
- Users in the last 30 minutes, which shows you how many users you had in the last 30 minutes and where they are located geographically.

Users in the last 30 minutes
- Recently viewed, which shows you several reports that you viewed recently.

Recently viewed quick menu
- Because you view frequently gives you certain data sets that you view on a regular basis.

“Because you viewed recently” quick menu
- Insights shows you some insights into areas you are seeing increases or decreases, or just unexpected changes.

Top level insights
Reports Snapshot in Google Analytics 4
The reports snapshot in GA4 shows you all the most popular data sets all in one place. This is a great place to see some top level info and track your progress at a glance.
As each of these data sets are pulled from other reports, which we go into more detail about in the next few sections of this guide, we won’t go into as much detail here.
The data sets included in the reports snapshot are:
- User behaviour
- Users in the last 30 minutes
- Insights
- New users by channel
- Number of sessions by channel
- Users by country
- User activity over time
- User activity by cohort
- Views by pages and screens
- Top events
- Top conversions
- Top selling products
- Conversions by platform
Underwhelmed by your digital marketing agency?
Learn all the signs that it might be time to change

Real-Time Overview report in Google Analytics 4
The real-time overview report shows you where users are browsing your site from in real time.
You can see which pages they are on, and even use this report to track them on their journey throughout your website.

The real-time overview report
Here you can see:
- Users in the last 30 minutes, and their device

Users in the last 30 minutes
- A geo-map showing active users on a world map

Interactive geo-map
- Users by first user source, first user medium, first user source platform or first user campaign. This shows you how your current users arrived on your website.

Users by first user source
- Users or new users by audience, so if you’ve set up audiences in GA4, it will show you if any of your active users are part of that audience.

Users or new users by audience
- Views by page title and screen name, so the pages your current users are visiting.

Views by page title and screen name
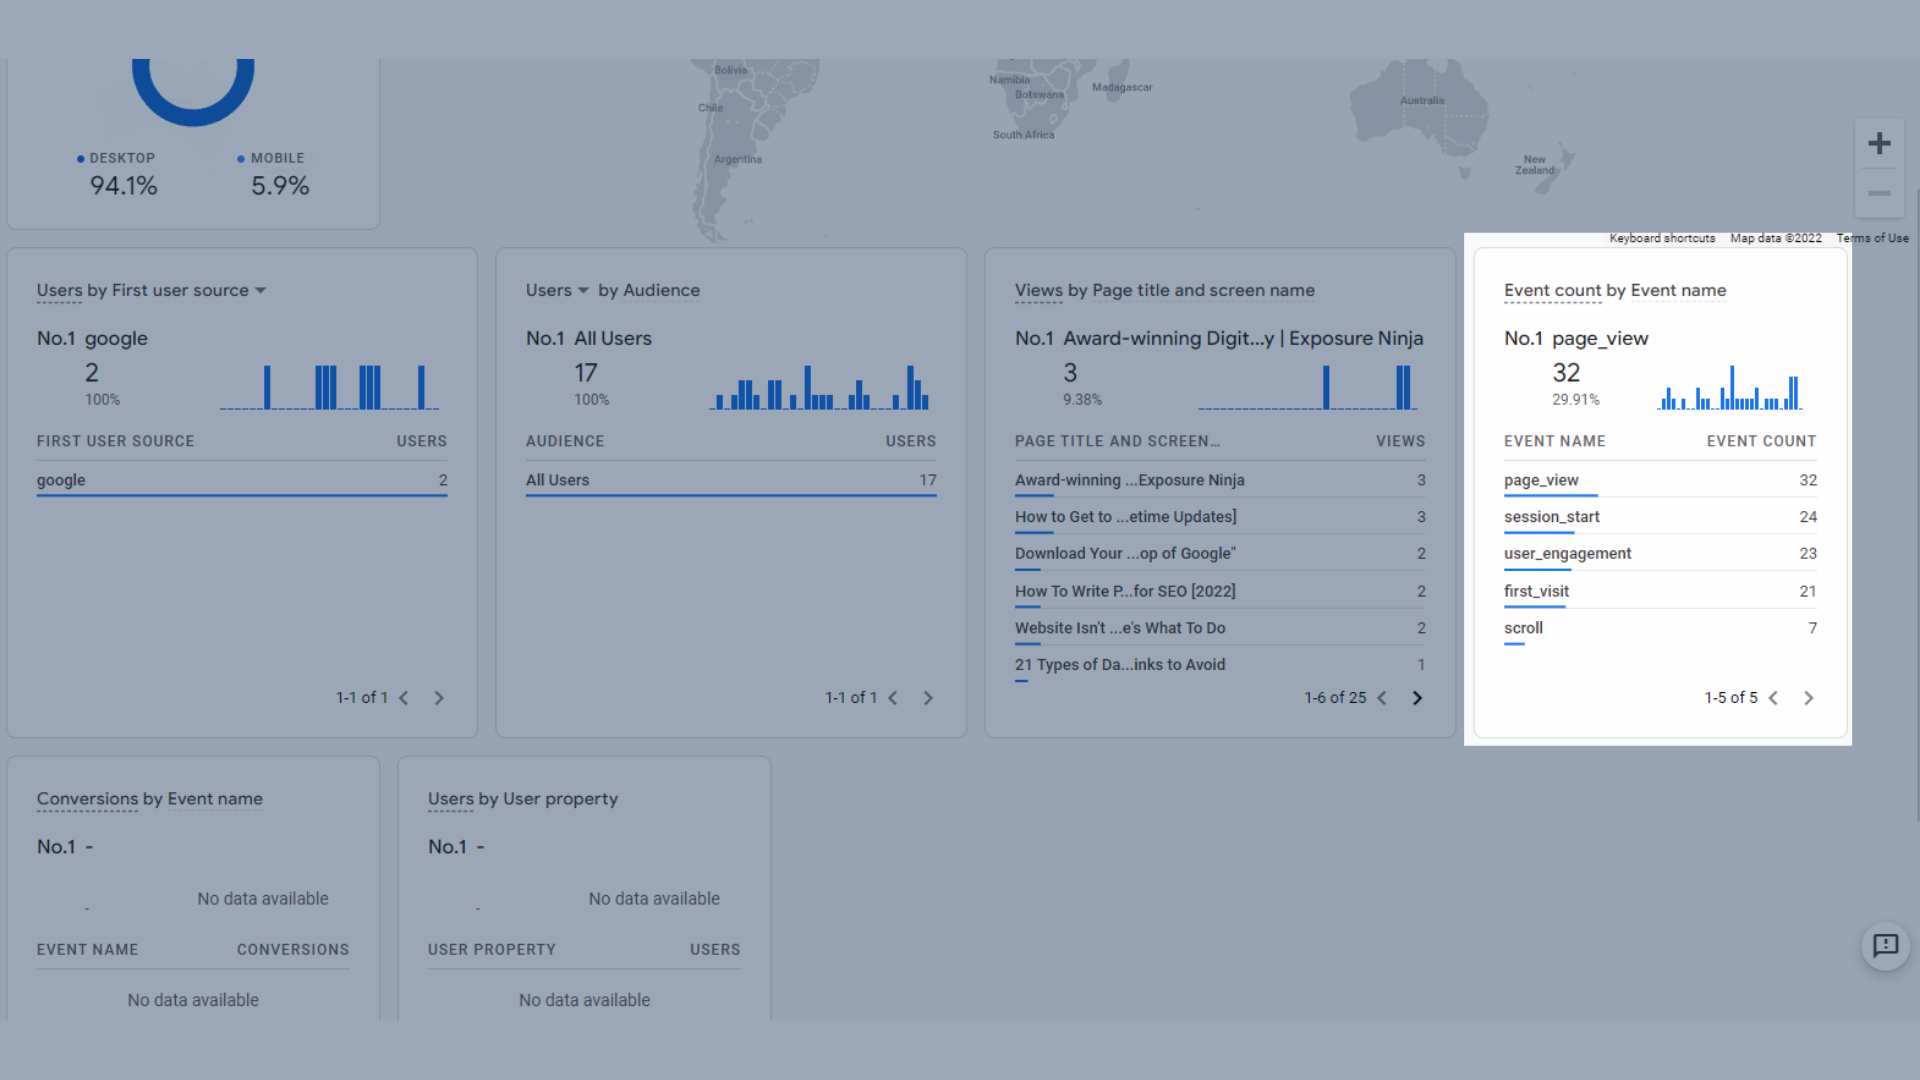
- Event count by event name, which shows you the most popular events in the last 30 minutes.

Event count by event name
- Conversions by event name, any conversions which happened in the last 30 minutes.

Conversions by event name
- Users by user property, any active users that are part of a predefined property. User properties in GA4 are more advanced, so they won’t be covered in this guide.

Users by user property
You can also use the view user snapshot button in the top right corner to follow the live journey of a user currently on your website. You’ll be able to see any events they trigger in real time.

View user snapshot in GA4
Life Cycle reports in GA4
Under Life cycle you can find acquisition, engagement, monetisation and retention reports.
We’re going to break each one down and explain what they all do, as well as the data included in each panel on these reports.
Acquisition reports in Google Analytics 4
The acquisition reports are found under reports – acquisition.

The location of acquisition reports in Google Analytics 4
Acquisition Overview
The Acquisition Overview page shows you key acquisition metrics all in one place.

Google Analytics 4 Acquisition Overview screen
Here you can see:
- The users trend graph, which shows a graph of users or new users to your website or app within your chosen time frame.

Users trend graph
- Users in the last 30 minutes, which shows how many visitors your site has had in the last 30 minutes, as well as their countries and a bar chart showing users per minute.

Users in the last 30 minutes graph
- New users by channel, which are automatically categorised by “First user default channel grouping”. This shows you how many visitors to your website came via each channel.
Default channel grouping shows the top channels by which the user was first acquired. You can’t create custom channel groups in GA4, which you could do in UA.
The default channel groupings in GA4 are:
- Direct Traffic
- Organic Search
- Paid Social
- Organic Social
- Affiliates
- Referral
- Paid Search
- Video
- Display
You can learn more on the Google Support page for default channel grouping.
Traffic sources are categorised into channels based on the rule-based definitions in the default channel grouping.
These new users can also be viewed based on the source, medium, platform or campaign that first acquired the users.

“New users by channel” graph
- Sessions, which is set to session default channel grouping, but can also be sorted by source, medium, platform and campaign. There’s also a sessions section focused on Google Ads

Sessions
- Lifetime value, which is a calculation done by Google Analytics to calculate the sum of purchase events, and AdMob earnings events during the user’s first 120 days of app usage. The lifetime value (LTV) is the average of this metric for all users.
- As you can see, we don’t have a need for this at Thinkplus right at this moment, hence why this section is blank.

Lifetime Value
User Acquisition
On the User Acquisition page, you can see:
- New users by first user default channel grouping, as a bar chart, which shows you which channel most of your new users came through

New users
- New users by first user default channel grouping over time, as a trend graph, which shows the same data as in the graph above, but shows trends over time, so you can see where some channels perform better than others on different dates.

New users over time trend graph
- As well as a table of data including the different types of user acquisition, which helps you compare different channels and see which are helping you get the most new visitors to your site.

User acquisition data
The dimensions used here are the pretty much the same as UA, and some examples include:
- Organic Search
- Direct
- Organic Video
- Organic Social
- Referral
- Paid Social
- Paid Search
- Organic Shopping
- Unassigned
These dimensions are then measured using the following metrics:
- New Users – The number of first time users in the selected time range
- Engaged Sessions – The number of sessions that lasted longer than 10 seconds, or had a conversion event, or had 2 or more screen or page views
- Engagement rate – The percentage of Engaged Sessions (Engaged Sessions divided by Sessions)
- Engaged sessions per user – Number of Engaged Sessions per user
- Average engagement time – The average length of time that your website had focus in the browser or your app was in the foreground
- Event count – The number of times your users triggered an event
- Conversions – The number of times your users triggered a conversion event
- Total revenue – The sum of revenue from purchases, subscriptions and advertising
You can refer to these definitions at any time by hovering over the relevant metric in Google Analytics.

Hover over the metric to see the description of it
Traffic Acquisition
This page is different to user acquisition, as it covers both new and returning users, and the traffic sources by which they land on your website.
On the Traffic Acquisition page you can see:
- Users by session default channel grouping over time as a trend graph, which helps you see which days had the most sessions per channel over a given time period.

Users by Session over time trend graph
- Users by session default channel grouping as a bar chart, which shows you similar data to the trend graph, but without the dates. This lets you see which or your traffic channels are generating the highest number of sessions.

Users by Session bar chart
And a table showing the main traffic acquisition dimensions and metrics, which are similar to the ones we saw in the User Acquisition tab. This helps you compare, in more detail, how well your channels are bringing in users.

Traffic acquisition table
These dimensions are then categorised by the following metrics:
- Users – The total number of active users
- Sessions – The number of sessions that began on your site or app
- Engaged Sessions – The number of sessions that lasted longer than 10 seconds, or had a conversion event, or had 2 or more screen or page views
- Average engagement time per session – User engagement duration per session
- Engaged sessions per user – Number of Engaged Sessions per user
- Events per session – Number of events triggered during the user’s session
- Engagement rate – The percentage of Engaged Sessions (Engaged Sessions divided by Sessions)
- Event count – The number of times your users triggered an event
- Conversions – The number of times your users triggered a conversion event
- Total revenue – The sum of revenue from purchases, subscriptions and advertising
So what are some changes here between UA and GA4?
In GA4 there’s no bounce rate, pages per session or average session duration.
Instead, there is a much bigger focus on “engagement” metrics.
Engaged sessions can be used to track bounce rate, as it tracks sessions longer than 10 seconds, converts, or has 2 or more page or screen views. The comparison between Sessions and Engaged Sessions can give you an idea of bounce rate.
To calculate this, take engaged sessions, divide this by sessions and times by 100 to get a percentage similar to what you would expect from bounce rate.
There are less standard acquisition reports in GA4, compared to UA, but you can create your own custom reports to somewhat replicate the ones you used regularly in UA.
Struggling to pitch an agency to your boss?
Download a free copy of How To Perfectly Pitch a Digital Marketing Agency to Your Boss and learn how to get buy-in from your manager.

Engagement Reports in GA4
Engagement reports in GA4 help you understand further how your users are interacting with your site. The reports in this section focus on the time users spent on your site and the events that were triggered while they were browsing.
We’ll go into more detail about events further down this guide.

GA4 Engagement Overview
Engagement overview
The Engagement Overview page includes all of your key engagement metrics on one screen.
These include:
- A trend graph showing average engagement time, engaged sessions per user and average engagement time per session. You can see the numbers at a glance, or switch between the different tabs to take a closer look at the trend graph.

Average engagement time, engaged sessions per user and average engagement graph
- Users in last 30 minutes, which shows the top pages and screens visited by users in the last 30 minutes

Users in last 30 minutes chart
- Graph showing views and event count, which shows how many events were triggered and how many page views happened.

Views and event count graph
- Event count by event name, so you can see which of your events are triggered most often.
Event count by event name table
- Views by page title and screen class, where you can see your most popular pages or screens at a glance

Views by page title and screen class table
- User activity over time, which shows you how many visitors return to your website over 1, 7 and 30 days.

User activity over time trend graph
- A user stickiness trend graph
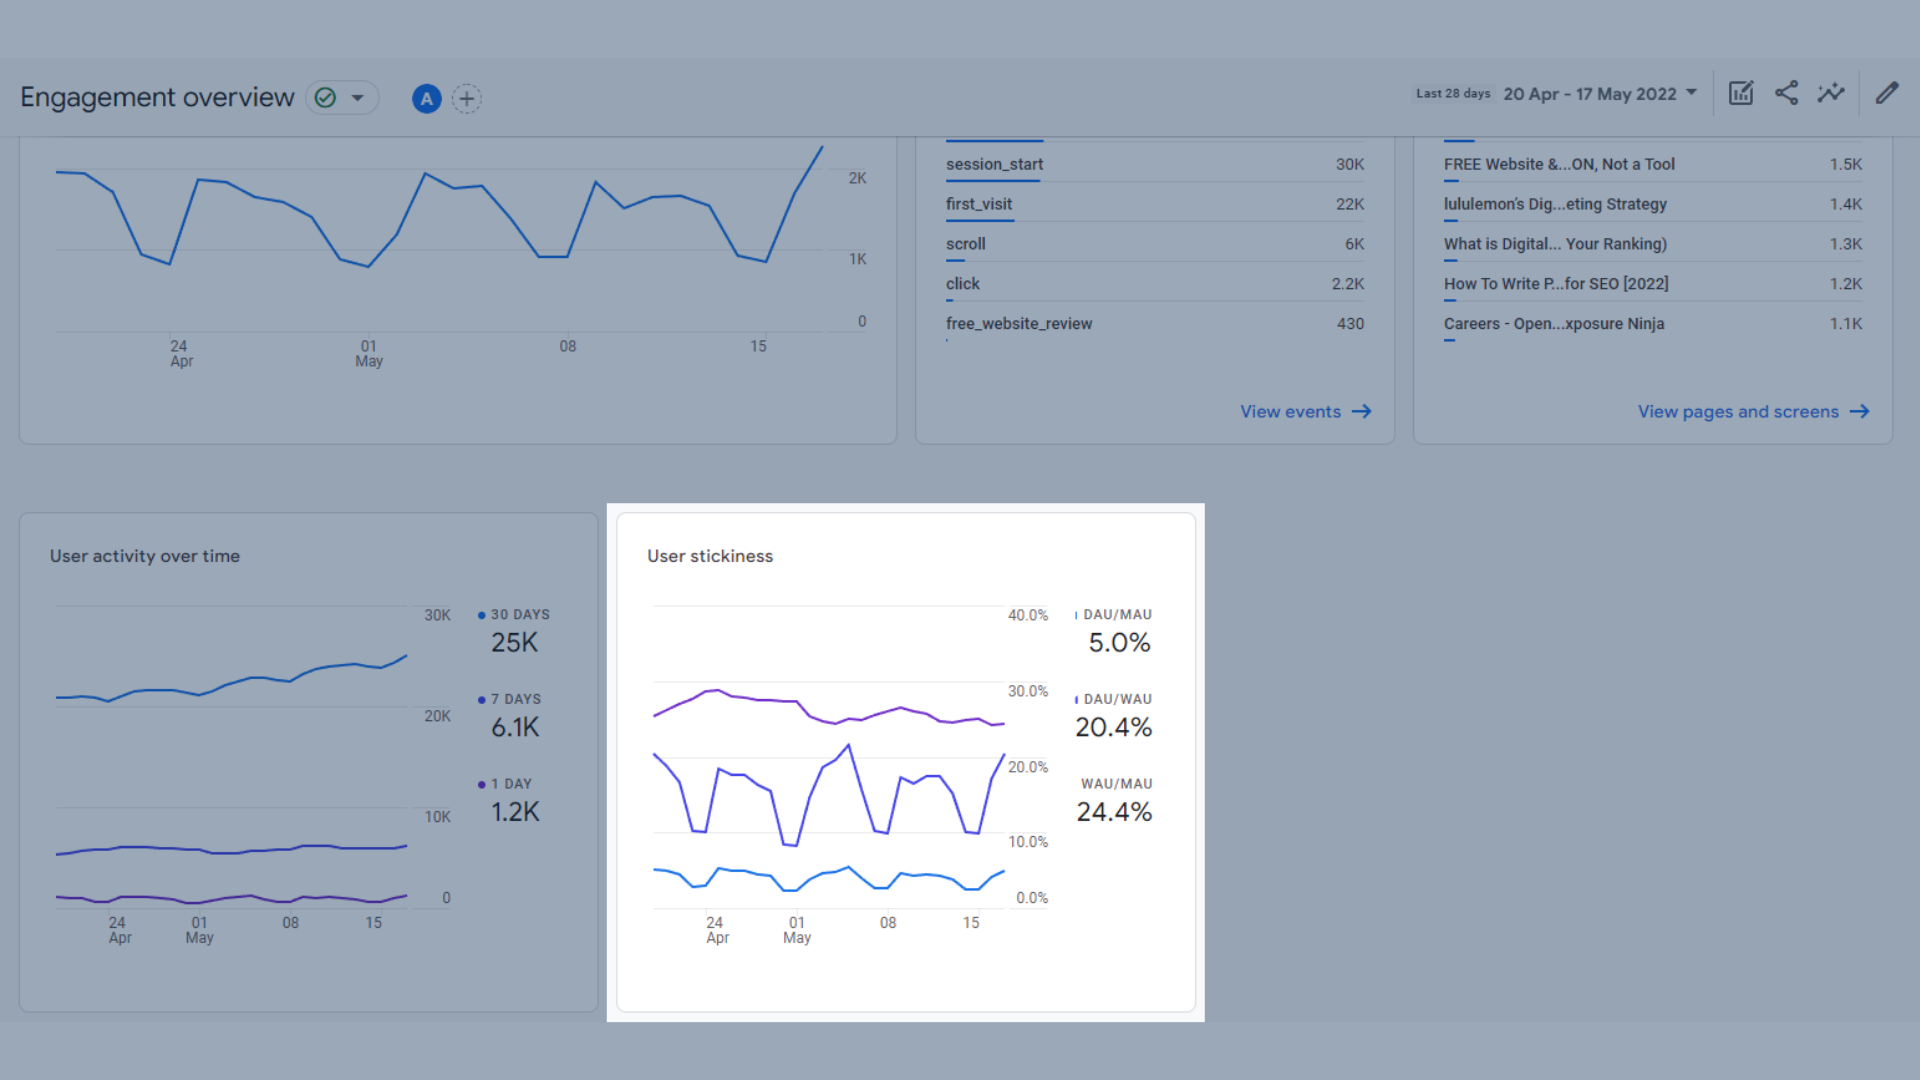
User stickiness trend graph in GA4
What is user stickiness? User stickiness is based on a few different things, but essentially, it’s how often people return to your site.
These ratios are as follows:
- Daily active users (DAU) / Monthly active users (MAU)
- Daily active users (DAU) / Weekly active users (WAU)
- Weekly active users (WAU) / Monthly active users (MAU)
These percentages are calculated by taking the ratio of average users for 1, 7 and 30 days(s).
This helps you to see if your website or app traffic are sticking around on your site for more than one visit.
Events
The events report is focused on events that you have decided to track. You’ll learn more about events and the different types of events in GA4 further down this guide.
This report includes:
- A trends graph showing event count by event name over time, which helps you see which events are triggered the most often in a given time frame. The exact events included here will depend on which events you set up in GA4.

A trends graph showing event count by event name over time
- A graph showing event count and total users by event name, which helps you see how many times an event has been triggered by users in a given time frame.
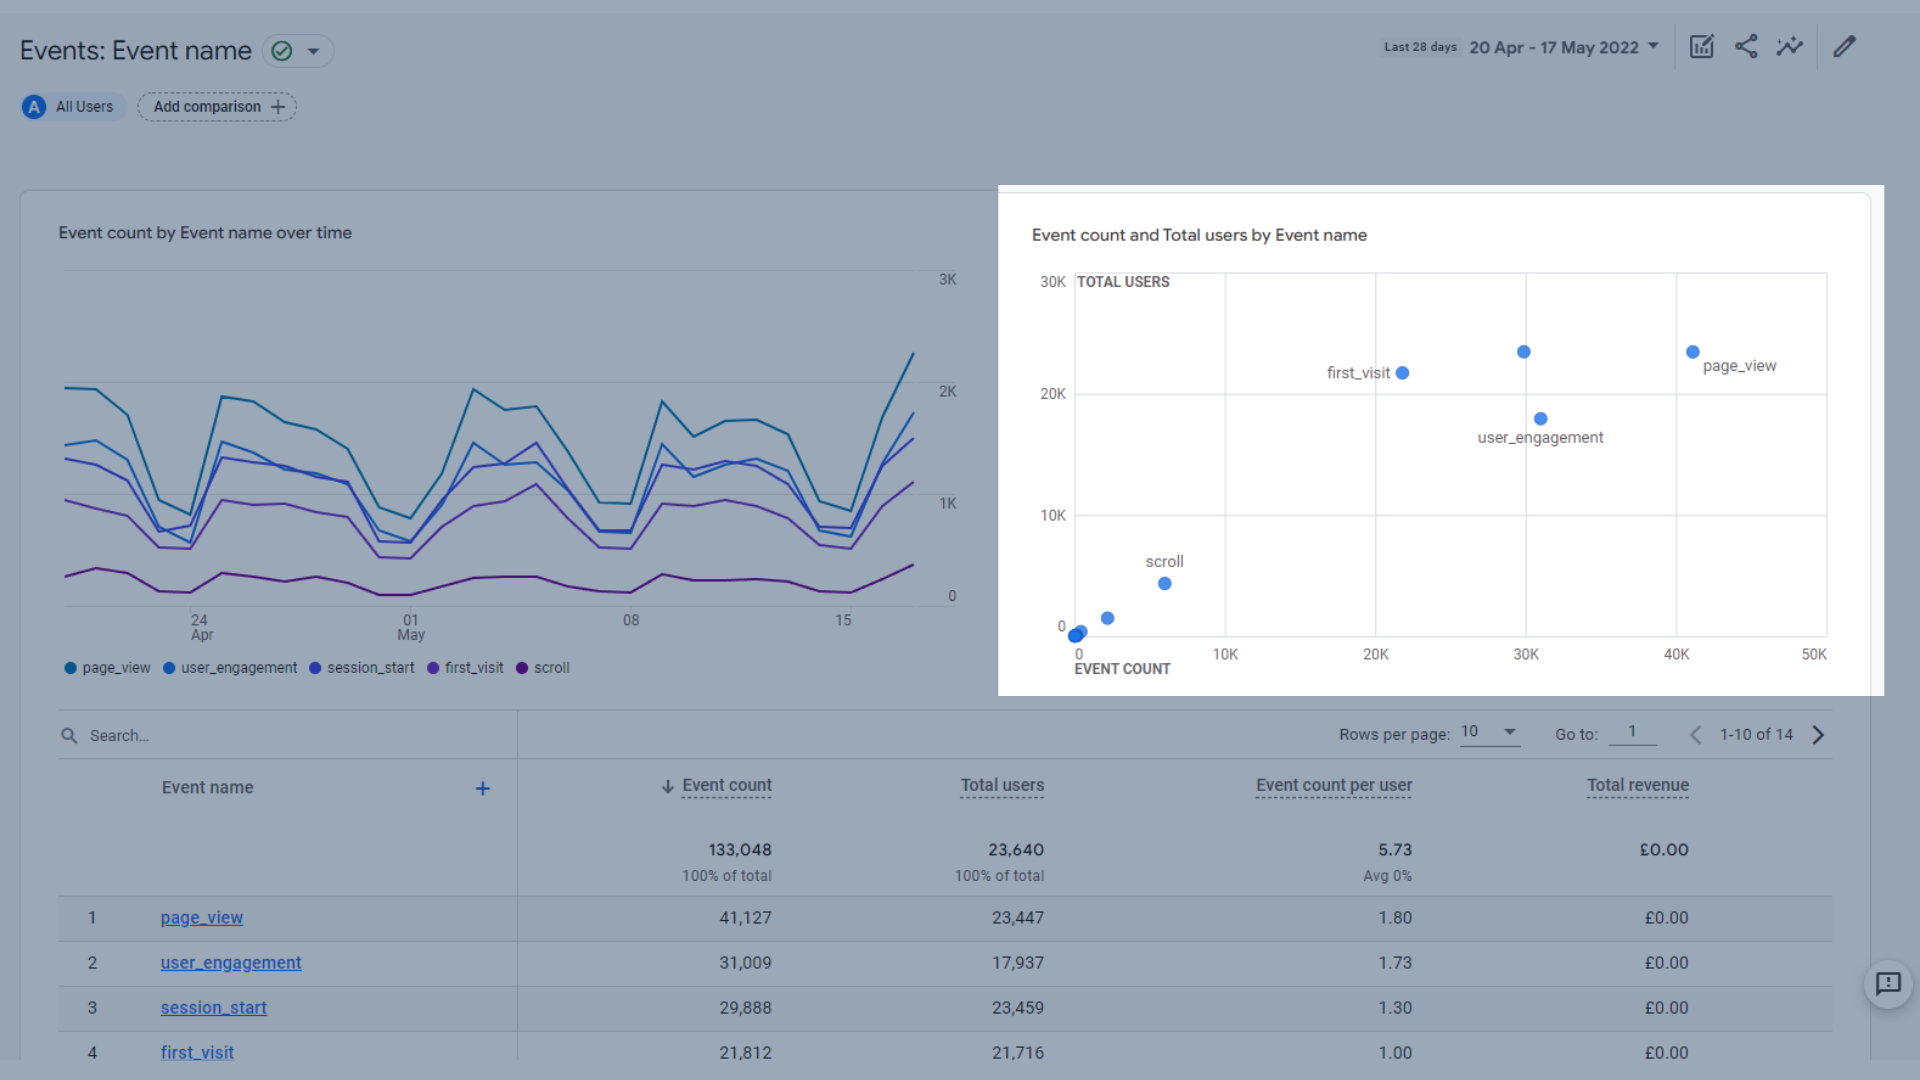
A graph showing event count and total users by event name
- A table which helps you see how your events are performing, covering how often they are triggered, how many users triggered them, the average number of times an individual user triggers an event, and the total revenue generated by each event, if applicable.
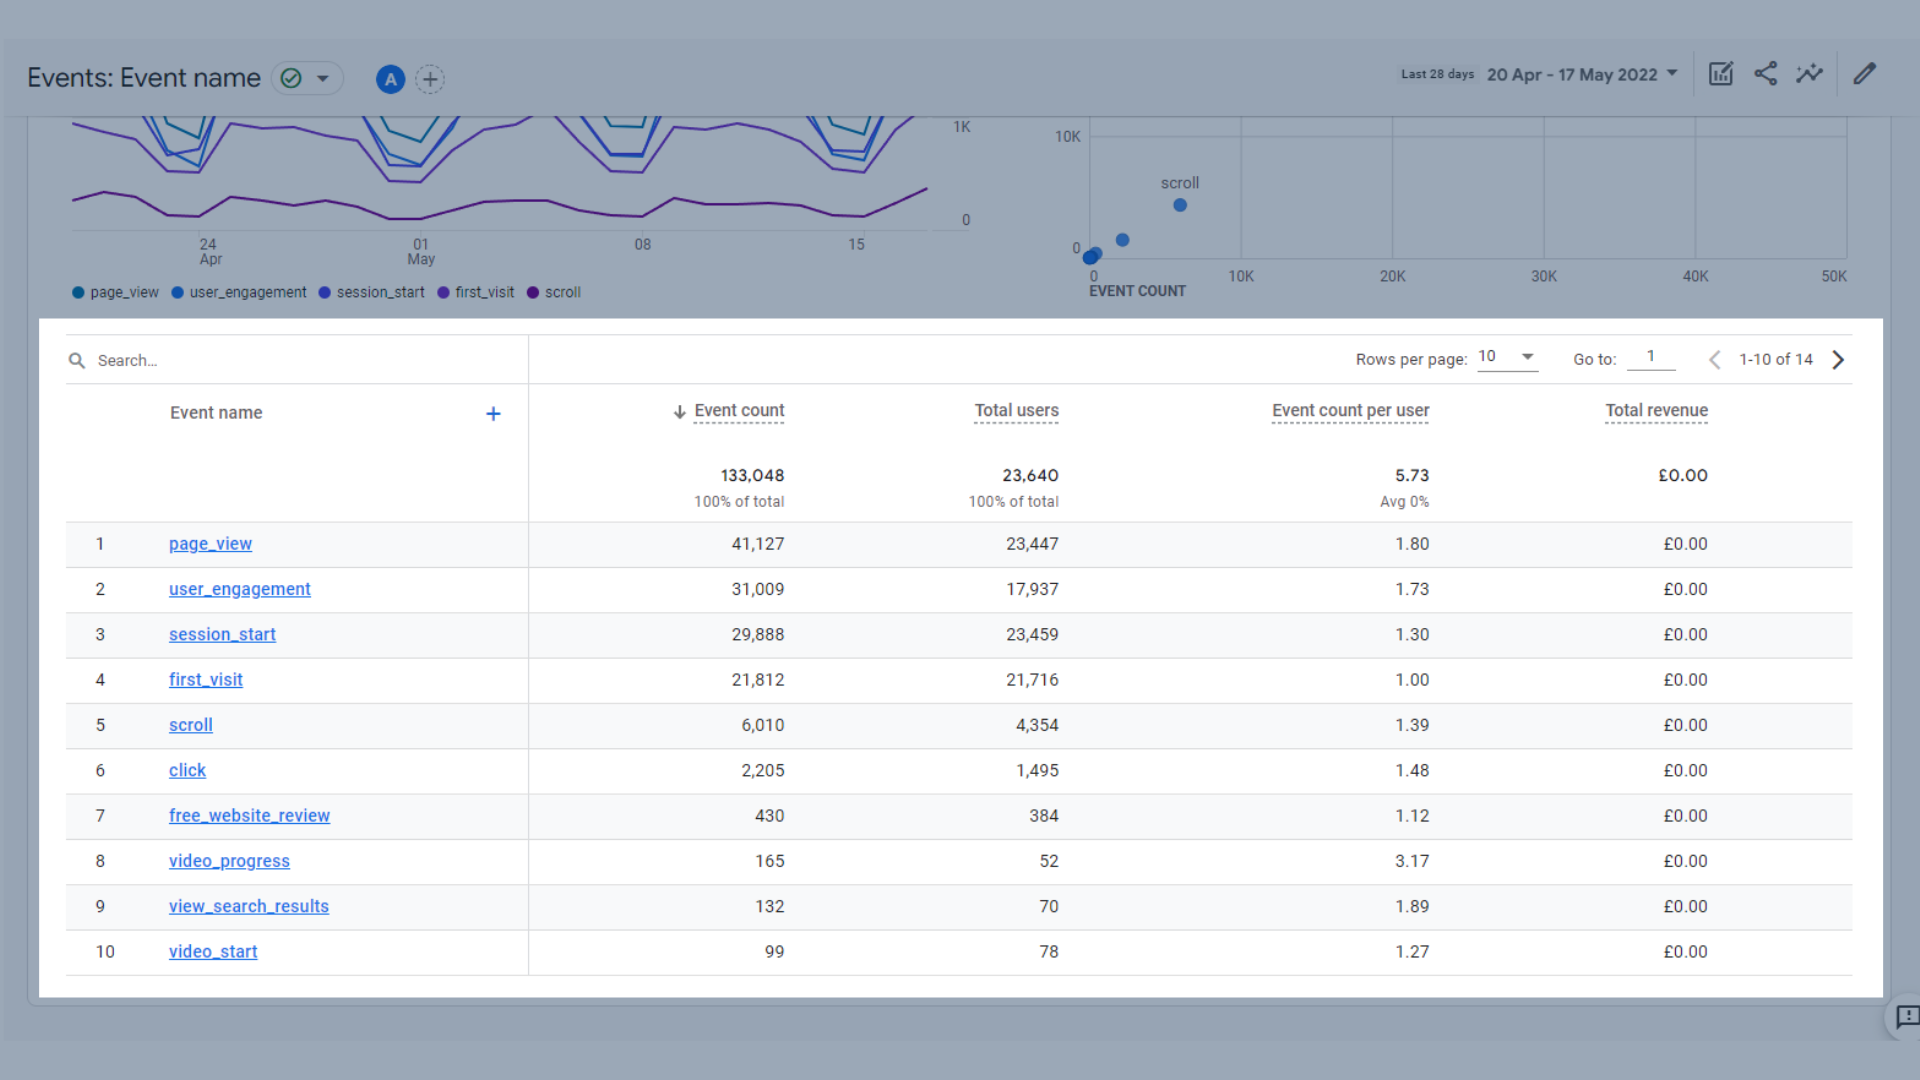
Events table
Key metrics included in this table are:
- Event Count – The number of times your users triggered an event
- Total Users – The total number of unique users who have logged an event
- Event Count Per User – The number of times a specific user triggered an event
- Total Revenue – The sum of revenue from purchases, subscriptions and advertising
Is your marketing underperforming?
Request a free website and marketing review and our team will tell you how to improve your marketing.
Conversions
The conversions report helps you see what is converting best on your site.
In GA4 conversions are events, which have been toggled to be tracked as conversions, hence why these reports often include the word event. We’ll explain more about events and conversions further down this guide.
- A trend graph of conversions by event name over time, which shows you how well the items on your site are converting. For us, conversions are things like someone requesting a free website and marketing review, or signing up to our mailing list.

A trend graph of conversions by event name over time
- A graph with conversions and total users by event name, which shows how many users completed a conversion in a given time frame

A graph with by event name
- A table showing how many times a conversion event converted, the total number of users that converted (some may have completed a conversion more than once) and event revenue.
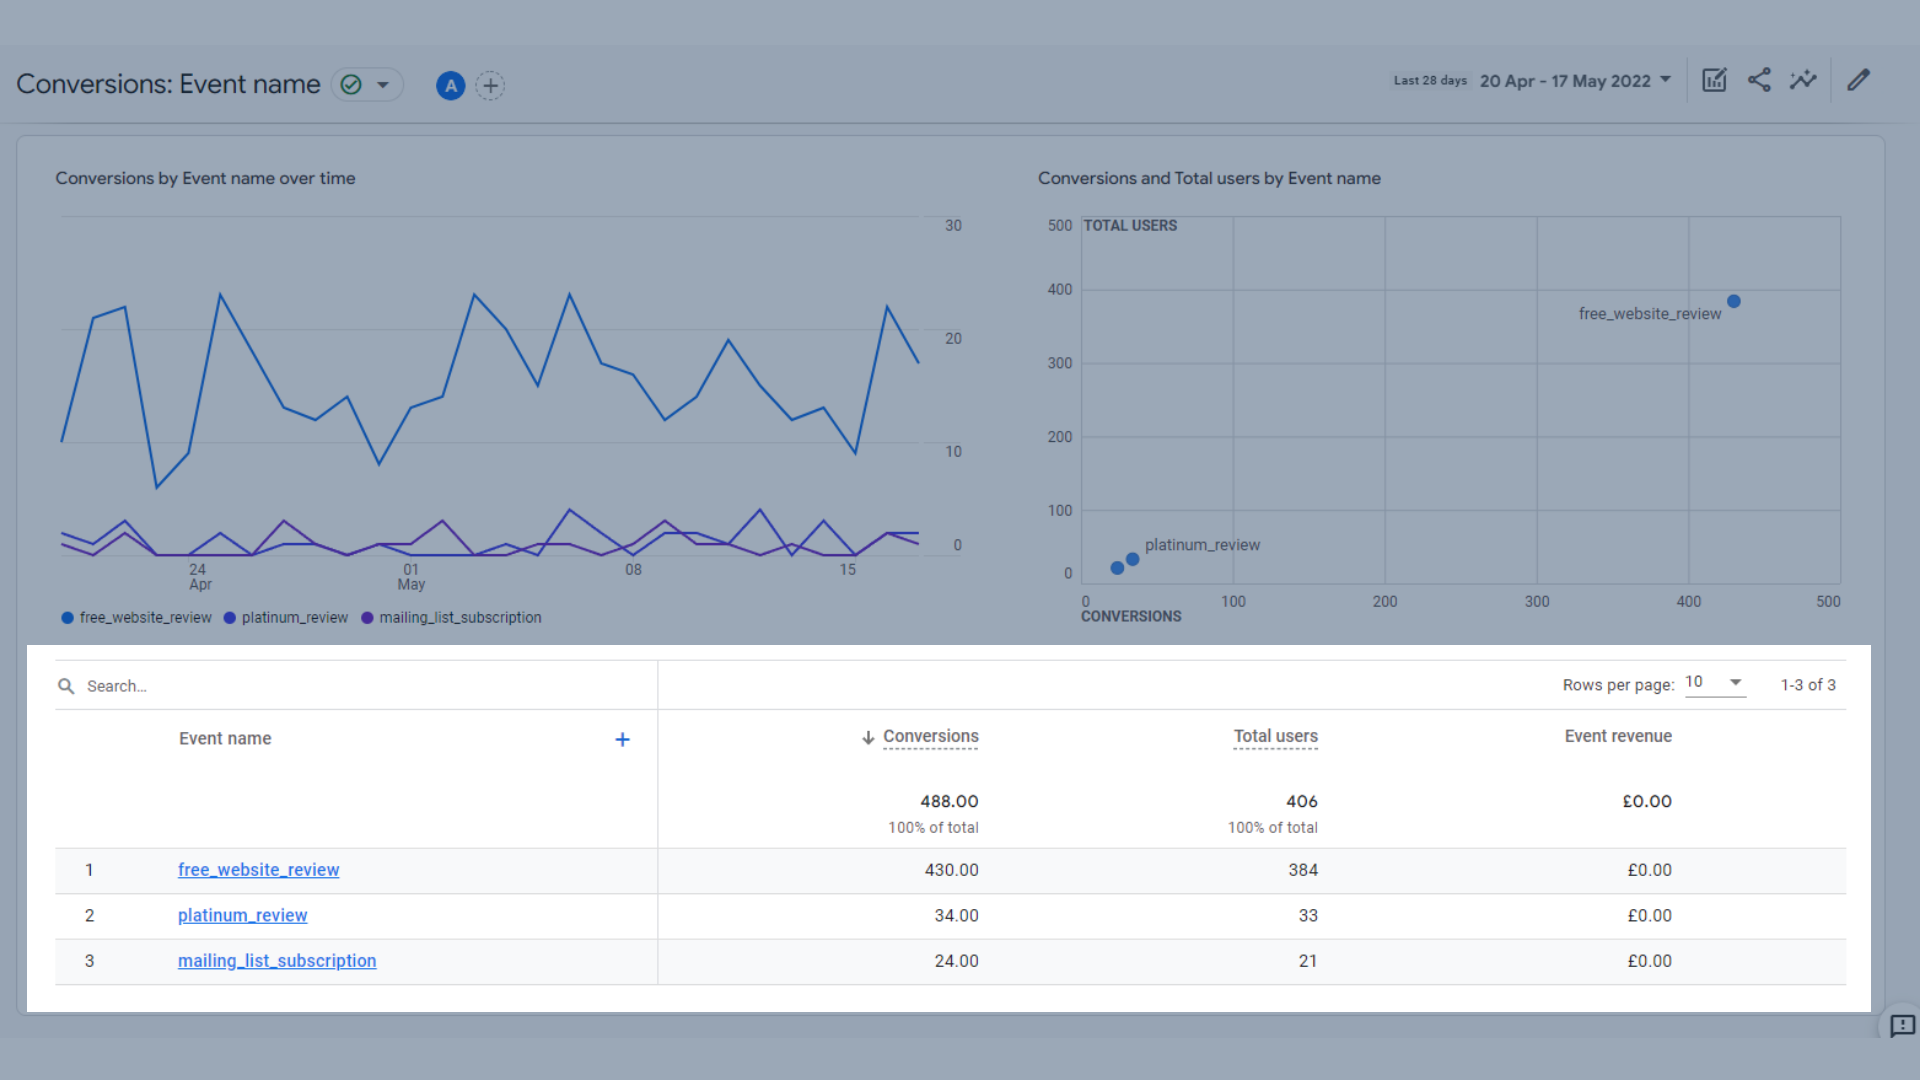
Conversion table
Key metrics included in this table are:
- Conversions – The number of times your users triggered a conversion event
- Total Users – The total number of unique users who have logged an event
- Event Revenue – The sum of revenue from purchases, subscriptions and advertising
Pages and Screens
The pages and screens report helps you see which pages on your website are performing best, or which could be performing better.
The data shown here is:
- A bar graph showing views by page title and screen class (page title for websites, screen class for apps)

Bar graph showing views by page title and screen class
- A graph showing views and users by page title and screen class, where you can see how many views a page is getting compared to the number of users. It’s a good way to see which pages have had repeat visitors

Graph showing views and users by page title and screen class
- A table where you can see all your page or screen views, users, average engagement time, and more.

Pages and Screens table
Key metrics included in this table are:
- Views – The number of app screens or web pages your users saw. Repeated views of a single screen or page are counted (screen_view+ page_view events).
- Users – The total number of active users
- New Users – The number of first time users in the selected time range
- Views Per User – The number of views by a specific user
- Average Engagement Time – The average length of time that your website had focus in the browser or your app was in the foreground
- Unique User Scrolls – The number of unique users that scrolled down at least 90% of the page
- Event count – The number of times your users triggered an event
- Conversions – The number of times your users triggered a conversion event
- Total revenue – The sum of revenue from purchases, subscriptions and advertising
Get to the top of Google
Learn how to get your website to the very top of Google (and turn that traffic into revenue).
Monetisation Reports in Google Analytics 4
Monetisation reports are for e-commerce businesses or aps with in-app purchases. Publisher ads are also covered here.
At Thinkplus we don’t have any of these monetisation elements on our website, so we’ll be using the Google Merchandise Store demo GA4 account as an example.
Monetisation Overview
The monetisation overview page collects together many of the key monetisation data into graphs and tables, which are as follows:
- Total revenue, e-commerce revenue and total ad revenue are together in the same trends graph. You can switch between them to see each one in more detail. The Google Merch Store isn’t running any ads on their site (where other publishers advertise their product or service on Google’s site), hence why this number is $0.

Total revenue, e-commerce revenue and total ad revenue trend graph
- A trend graph of total purchases and first time purchasers in a given time frame, so you can see how many new purchases you have compared to return purchasers.

Trend graph of total purchases and first time purchasers
- A trend graph of average purchase revenue per user, in other words, how much on average you make from each purchase.

Trend graph of average purchase revenue per user
- A table of e-commerce purchases by item name, which gives you a quick overview of which of your items are your top sellers. Next to this is e-commerce purchases by item list name, which shows similar data, but for lists of items. For example, if you add all your t-shirts to a list, and t-shirts are your top sellers, they’ll show up here.

Table of e-commerce purchases by item name
These last 4 parts of the report are not currently being used by the Google Merch Store, hence why they are not showing any data. It’s good to know what they do and where they are located, in case you do need to use them.
- A list of item views by promotion, which shows you which items, labelled as part of a promotion (such as a sale or buy one get one free offer) were viewed the most often.

Table of item views by item promotion name in GA4
- A list of e-commerce revenue by order coupon, so you can see at a glance which online coupons are generating you the most revenue.

List of e-commerce revenue by order coupon
- A list of product revenue by product ID. This helps you see your in app revenue from in-app purchases, so you can see what is most popular.
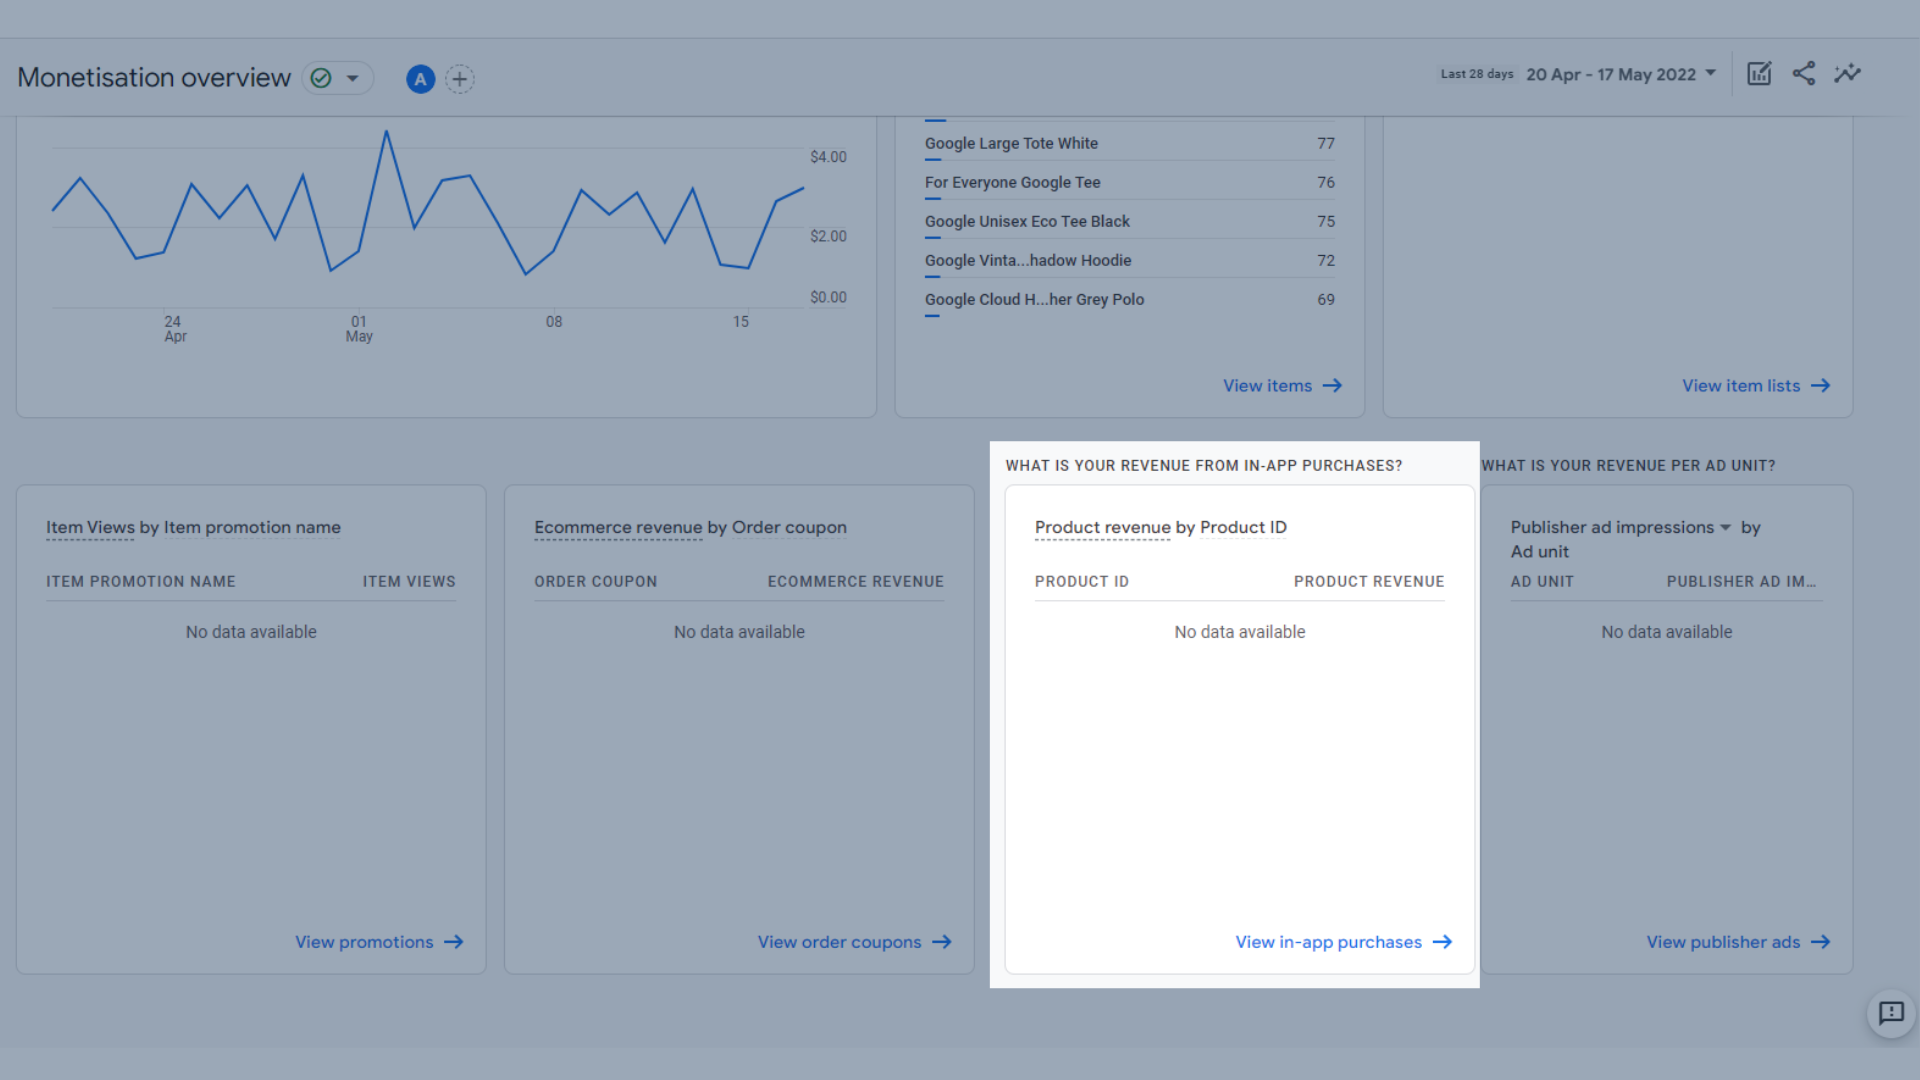
A list of product revenue by product ID
- List of publisher ad impressions by ad unit. You can also view published ad clicks by ad unit using the drop down. This shows you your revenue per ad unit that is being run on your site.

List of publisher ad impressions by ad unit
E-commerce purchases
The e-commerce purchases report gives you an insight into the sales on your e-commerce site.
The data here includes:
- A trend graph of item views by item name over time, which is useful for seeing which items are getting viewed the most
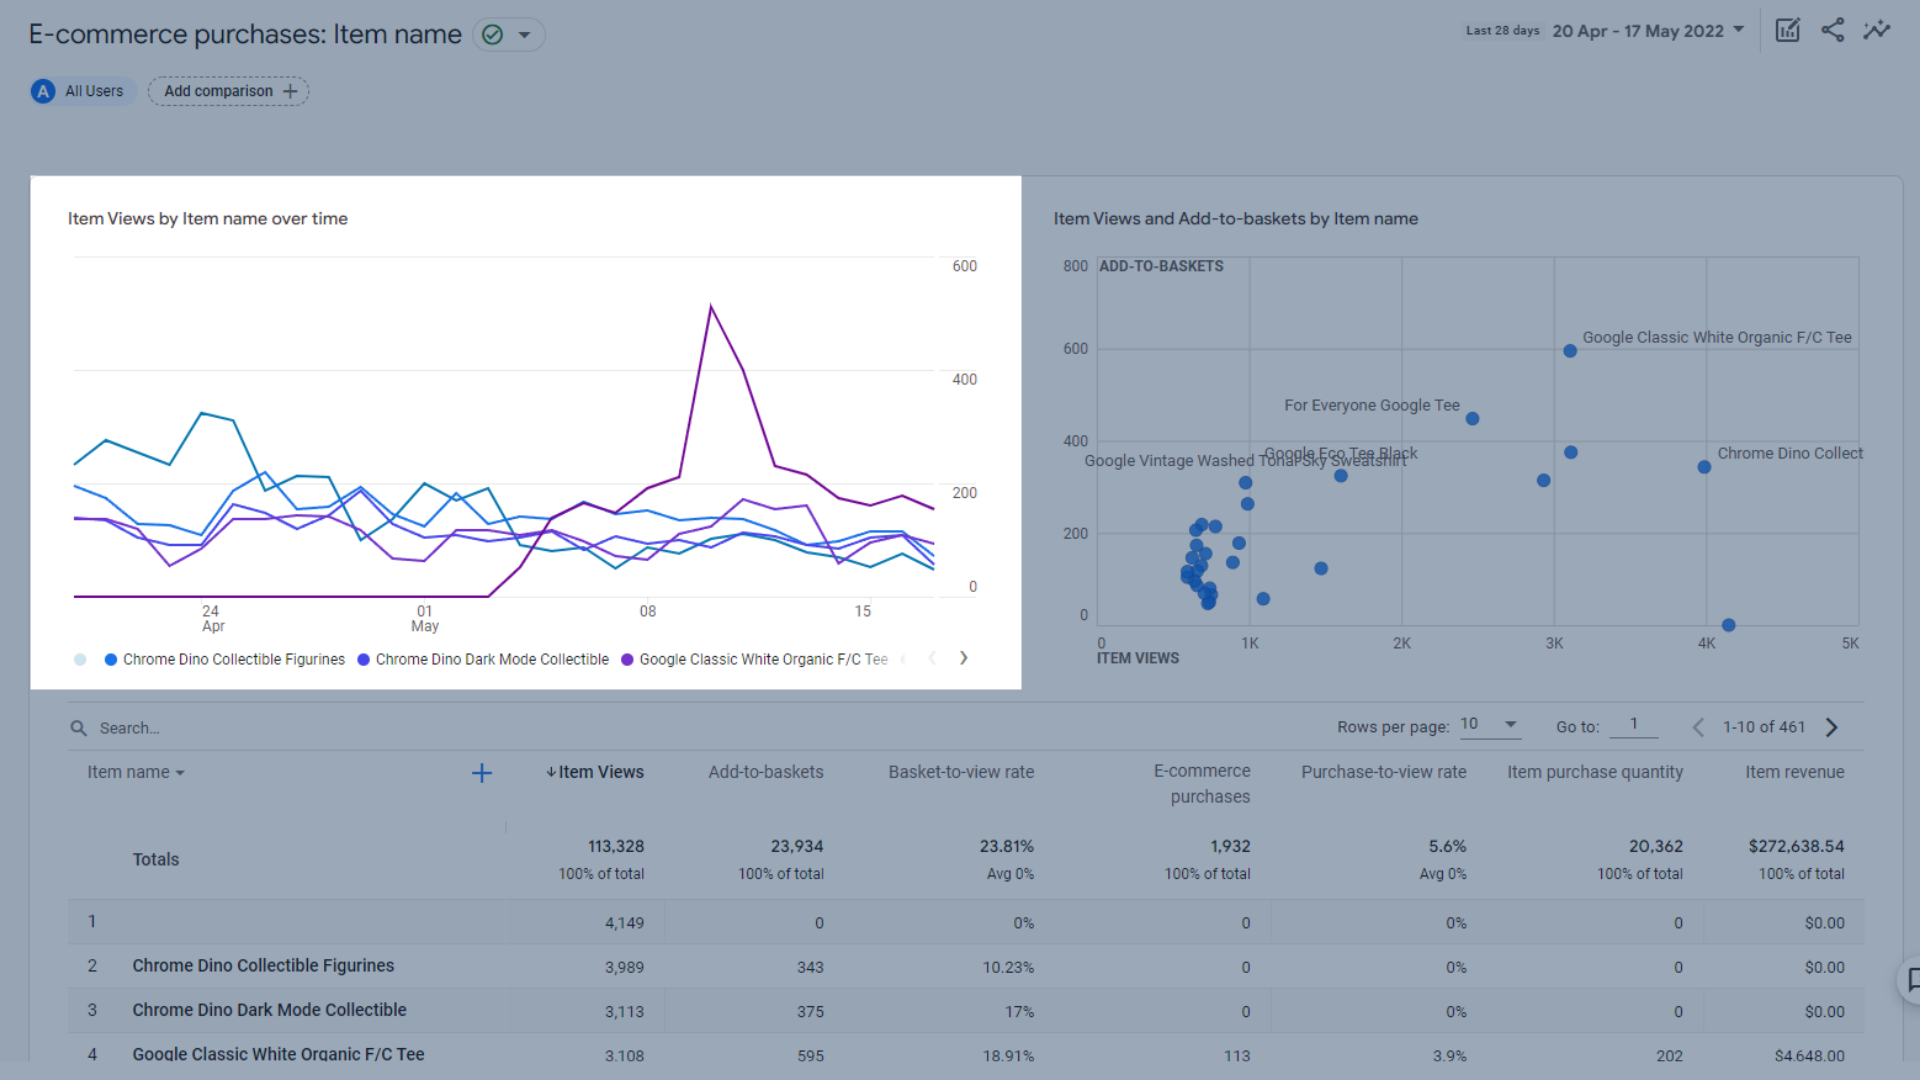
A trend graph of item views by item name over time
- A graph of item views and add-to-baskets by item name, which is useful for seeing which items are being added to basket, but maybe aren’t being purchased

Graph of item views and add-to-baskets by item name
- A table of all your e-commerce products and their performance

Table of e-commerce products and their performance
Key metrics included in this table are:
- Item views – How many times an item was viewed
- Add-to-baskets – How many times an item was added to users baskets
- Basket-to-view rate – The number of users who added a product to their cart, divided by the number of users who viewed the same product
- E-commerce Purchases – How many times a product was purchased via the website
- Purchase-to-view rate – The number of users who purchased a product, divided by the number of users who viewed the same product
- Item purchase quantity – The number of units sold via the website
- Item Revenue – Total revenue from items sold
In-app purchases
This report focuses on data regarding in-app purchases from a mobile app.
Here you can see:
- Quantity by Product ID over time, where you can see at a glance how many of a certain type of in app-purchase were sold
- Quantity and product revenue by ID, which shows you how much you made from certain types of in-app purchases.
- A table of data showing the quantity of a certain in app purchase sold, the revenue from that and the average product revenue.
Publisher ads
This report shows you how much you made from publisher ads run on your website.
It includes:
- Publisher ad impressions by ad unit over time, which shows you how your publishers ads have performed over a given time frame
- Publisher ad impressions and ad unit exposure by ad unit, which shows you how many times an ad was viewed on your site
- A table of all your publisher ad data, including published ad impressions, ad unit exposure, publisher ad clicks and total ad revenue
Retention Report in Google Analytics 4
The retention report in GA4 shows you how many visitors have returned to your website over a given time period. This is great for seeing how your users behave – do they visit as a one off, or are you providing value to them which makes them want to return?
This report includes:
- A trend graph of new users and returning users, so you can see how many visitors came back to your website after their first visit
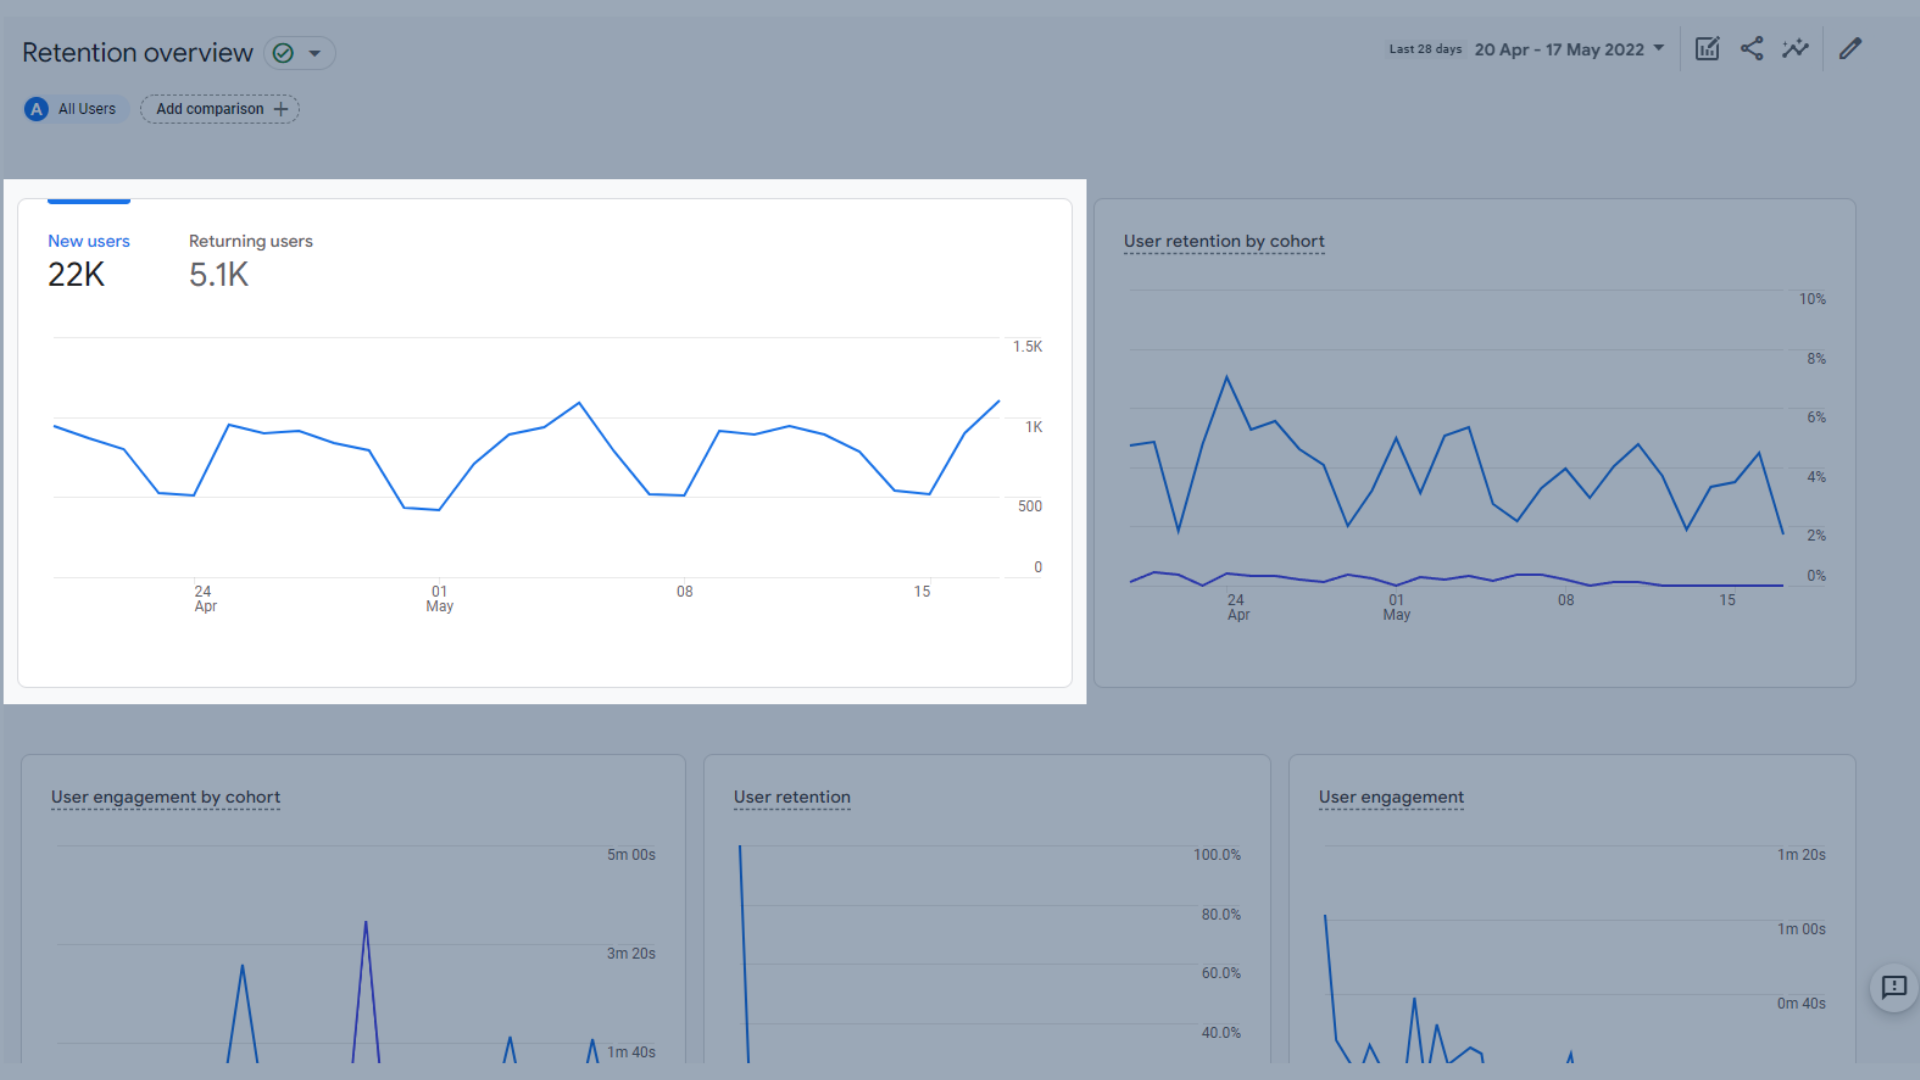
Trend graph of new users and returning users
- A trend graph of user retention by cohort, which shows the percentage of new-user cohort on certain dates who return each day. This metric is a look-forward view and will only calculate if there is enough data available, so if you don’t see this in your own retention report, don’t panic.
A cohort is a group of users who share a common characteristic that has been identified in your report by an analytics dimension, for example, all the users with the same Acquisition Date are added to the same cohort. In the user retention by cohort graph, the two cohorts are new users and returning users.
If you’d like to explore a cohort further, you can do so in a custom report in the explore section, which we’ll cover further down this guide.

Trend graph of user retention by cohort
- User engagement by cohort, which shows the average engagement time of new users on certain dates who return each day. This metric is a look-forward view and will only calculate if there is enough data available, so if you don’t see this in your own retention report, don’t panic.

Trend graph of user engagement by cohort
- A user retention trend graph, which shows the number of new users that return each day for the last 42 days

User retention trend graph
- A user engagement trend graph, showing the average engagement time of retained users from first_open. In more simple terms, it shows how much time returning users spent on the site in the last 42 days, which days they returned on and how much time they spent on that day. So if they returned 5 days after their last visit and spent 2 minutes on the site, you’d see that reflected in this graph.

User engagement trend graph
- The last graph is the lifetime value graph. For each new user, Google Analytics calculates the sum of purchase events and AdMob earnings events during the user’s first 120 days of app usage. The lifetime value (LTV) is the average of this metric for all users.

Lifetime value trend graph
Struggling to get all your marketing done?
Download our marketing priority planner and get your marketing back on track.
Demographic Reports in GA4
Now we’re moving onto the User reports section, starting with the demographic reports. These reports are fairly straight forward, and easier to understand than many of the above reports.
Demographics Overview
The demographics overview is where you can see some top level info about the visitors to your site. You can learn more about where they live, their language, their gender, interests and age. Currently, both our own GA4 account and Google’s demo account are not providing us with gender, interest or age data as this feature has not been enabled.
To enable the collection of gender, interests and age in Google Analytics 4, you can do so by following these steps.
- Head to the Admin section of GA4
- In the Property column, select “Data Settings”
- Click “Data Collection”
- Select the “Google Advertising Features Policy” link and read though the policy
- Click “Continue”
- Click “Activate”
Your Google Signal collection is now set up. It will take 24 hours to populate, and after that you can see some demographic data about your audience.
In the demographics overview, different data sets can be filtered to view all users, new users or returning users.
Here you can see:
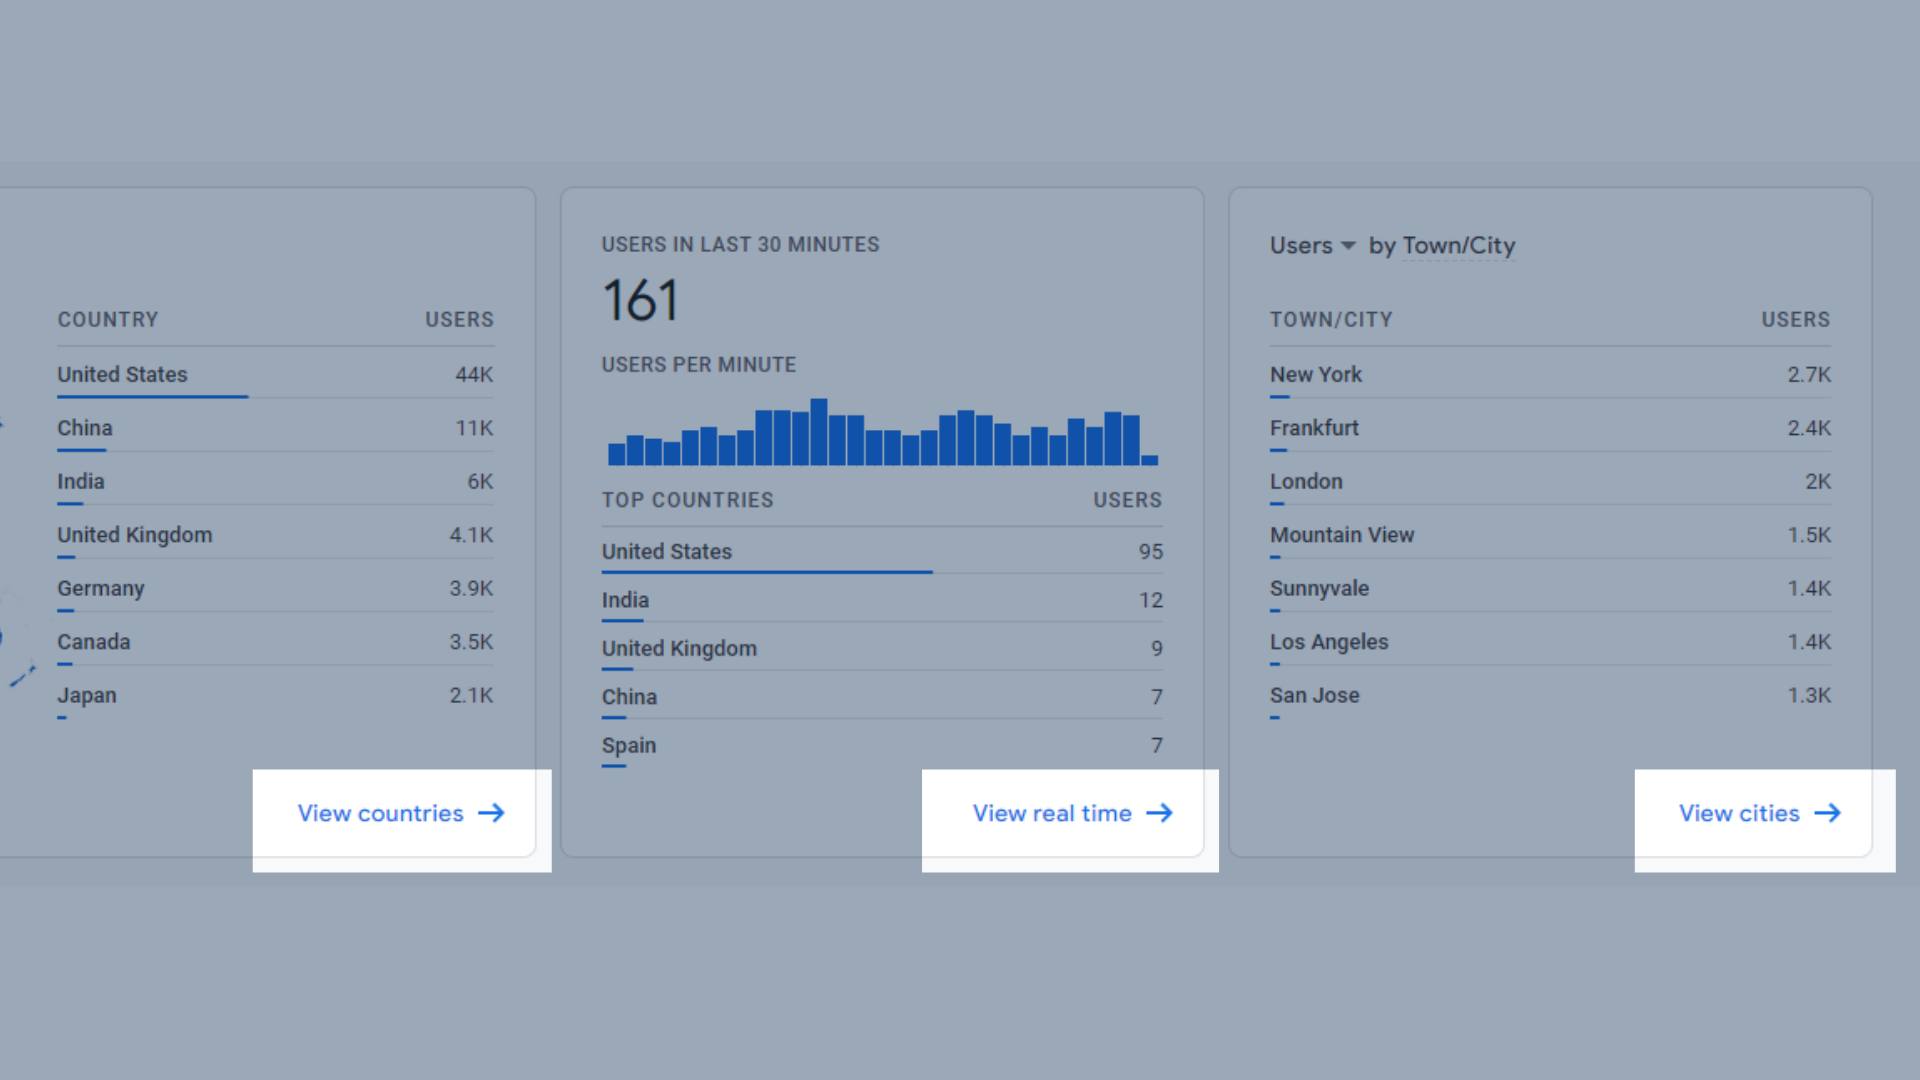
- Users by country, represented by a world map and in a graph

A world map showing users by country
- Users in the last 30 minutes and the top countries those users were from.

Users in the last 30 minutes chart
- Users by town/city
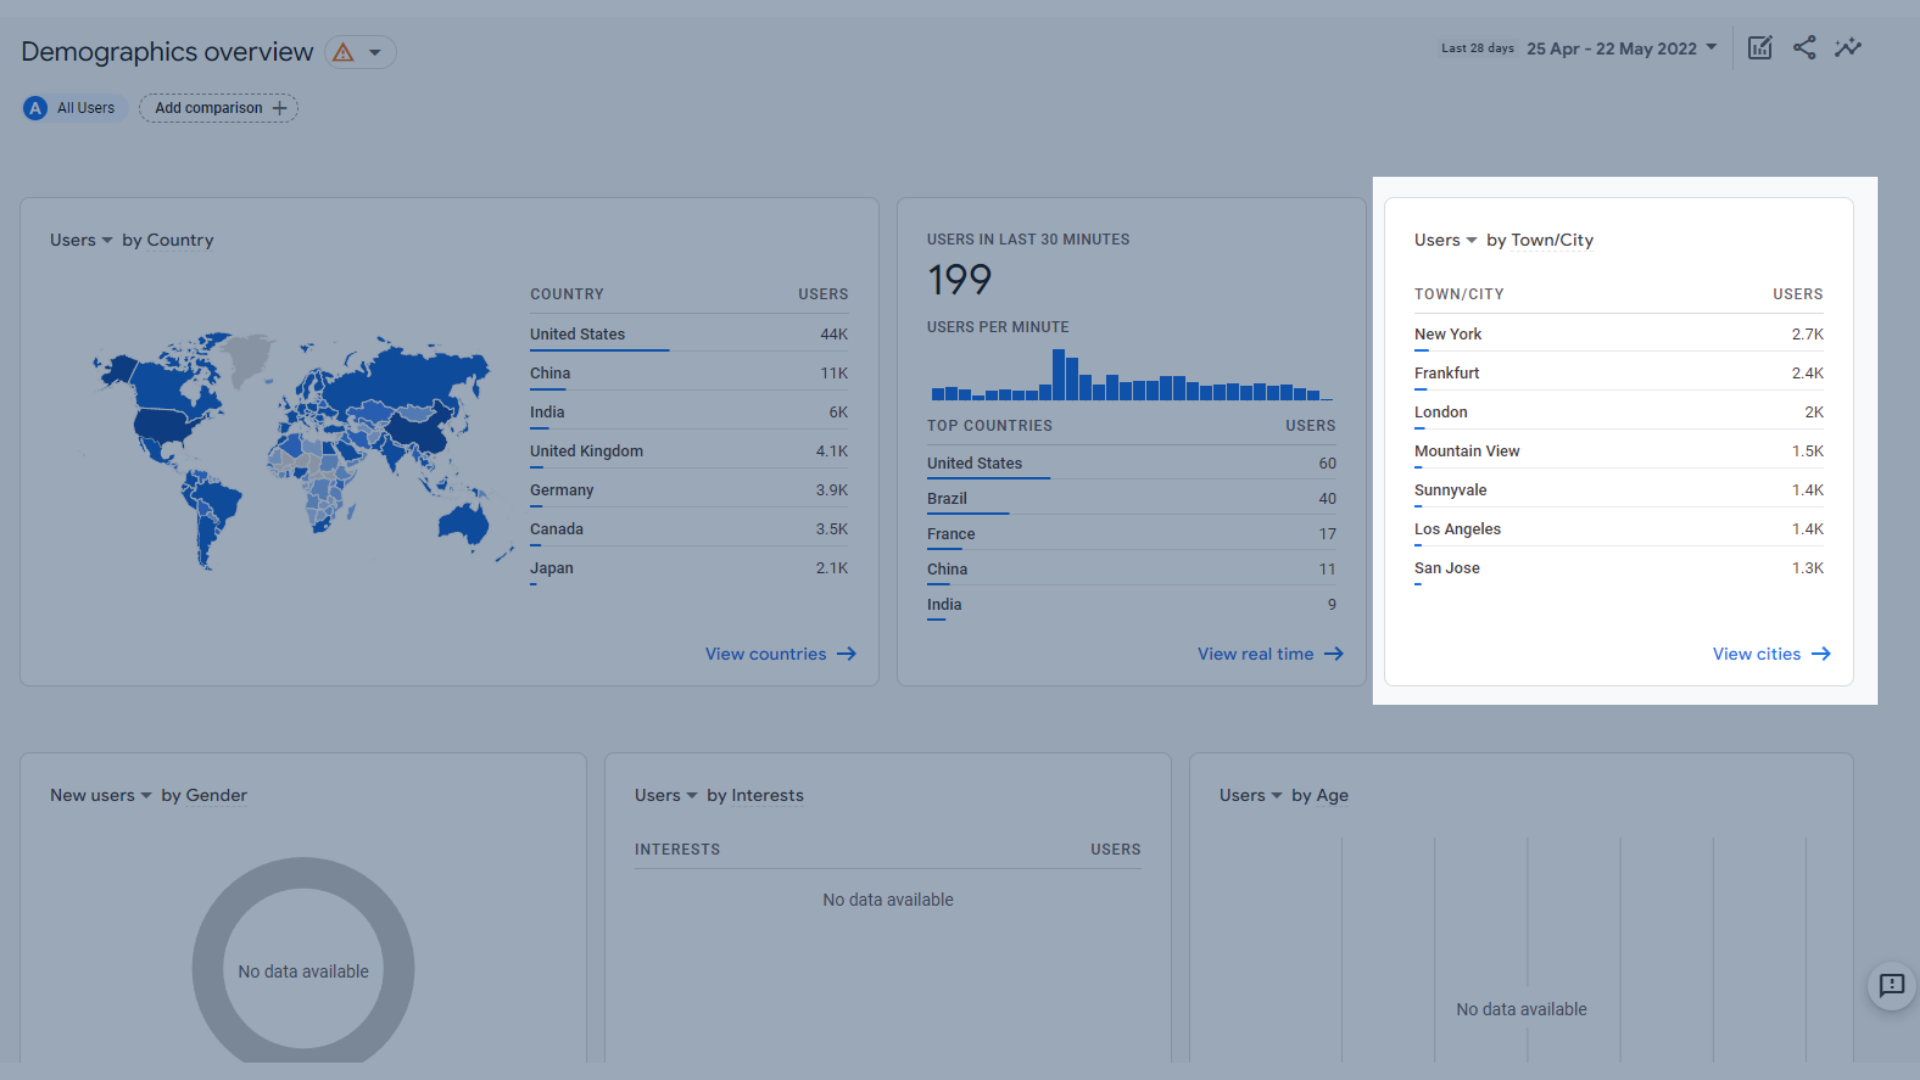
Users by town/city
- Users by gender

Users by gender chart
- Users by interests

Users by interests
- Users by age
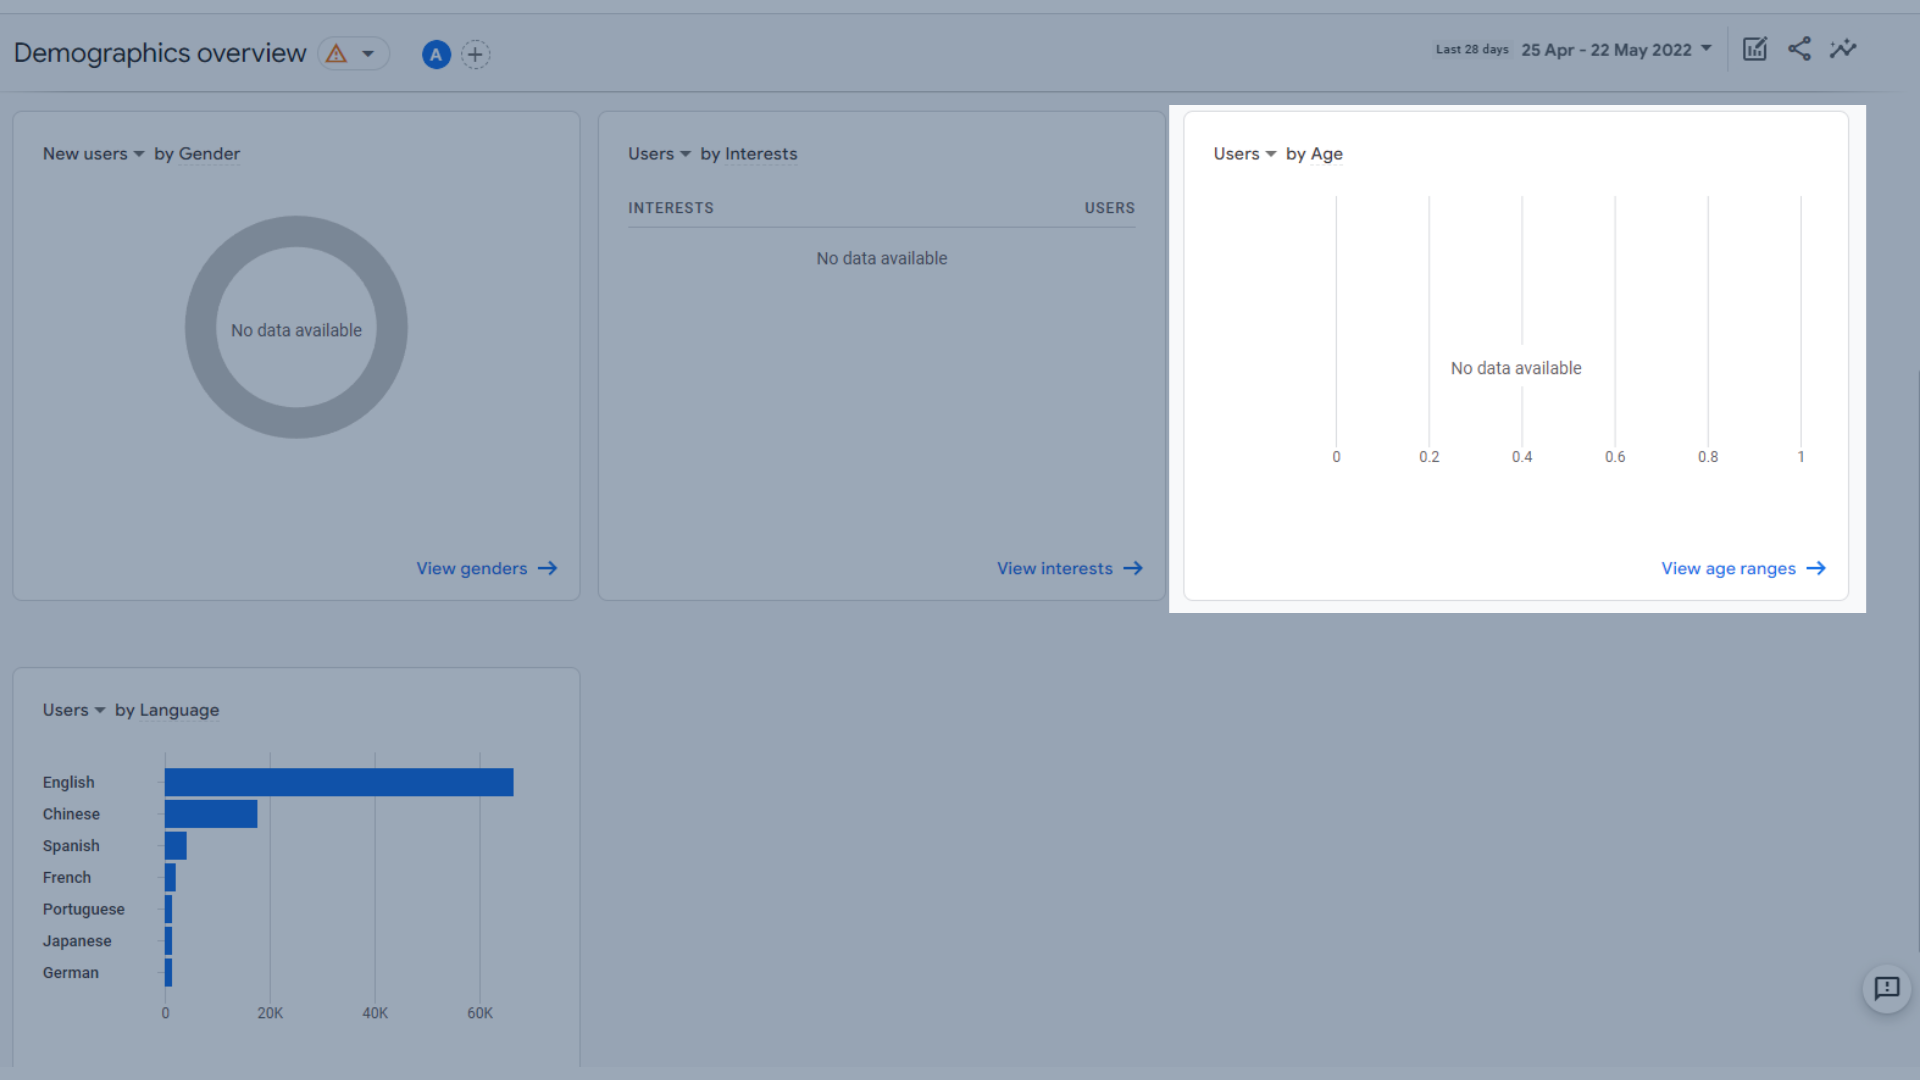
Users by age chart
- Users by language
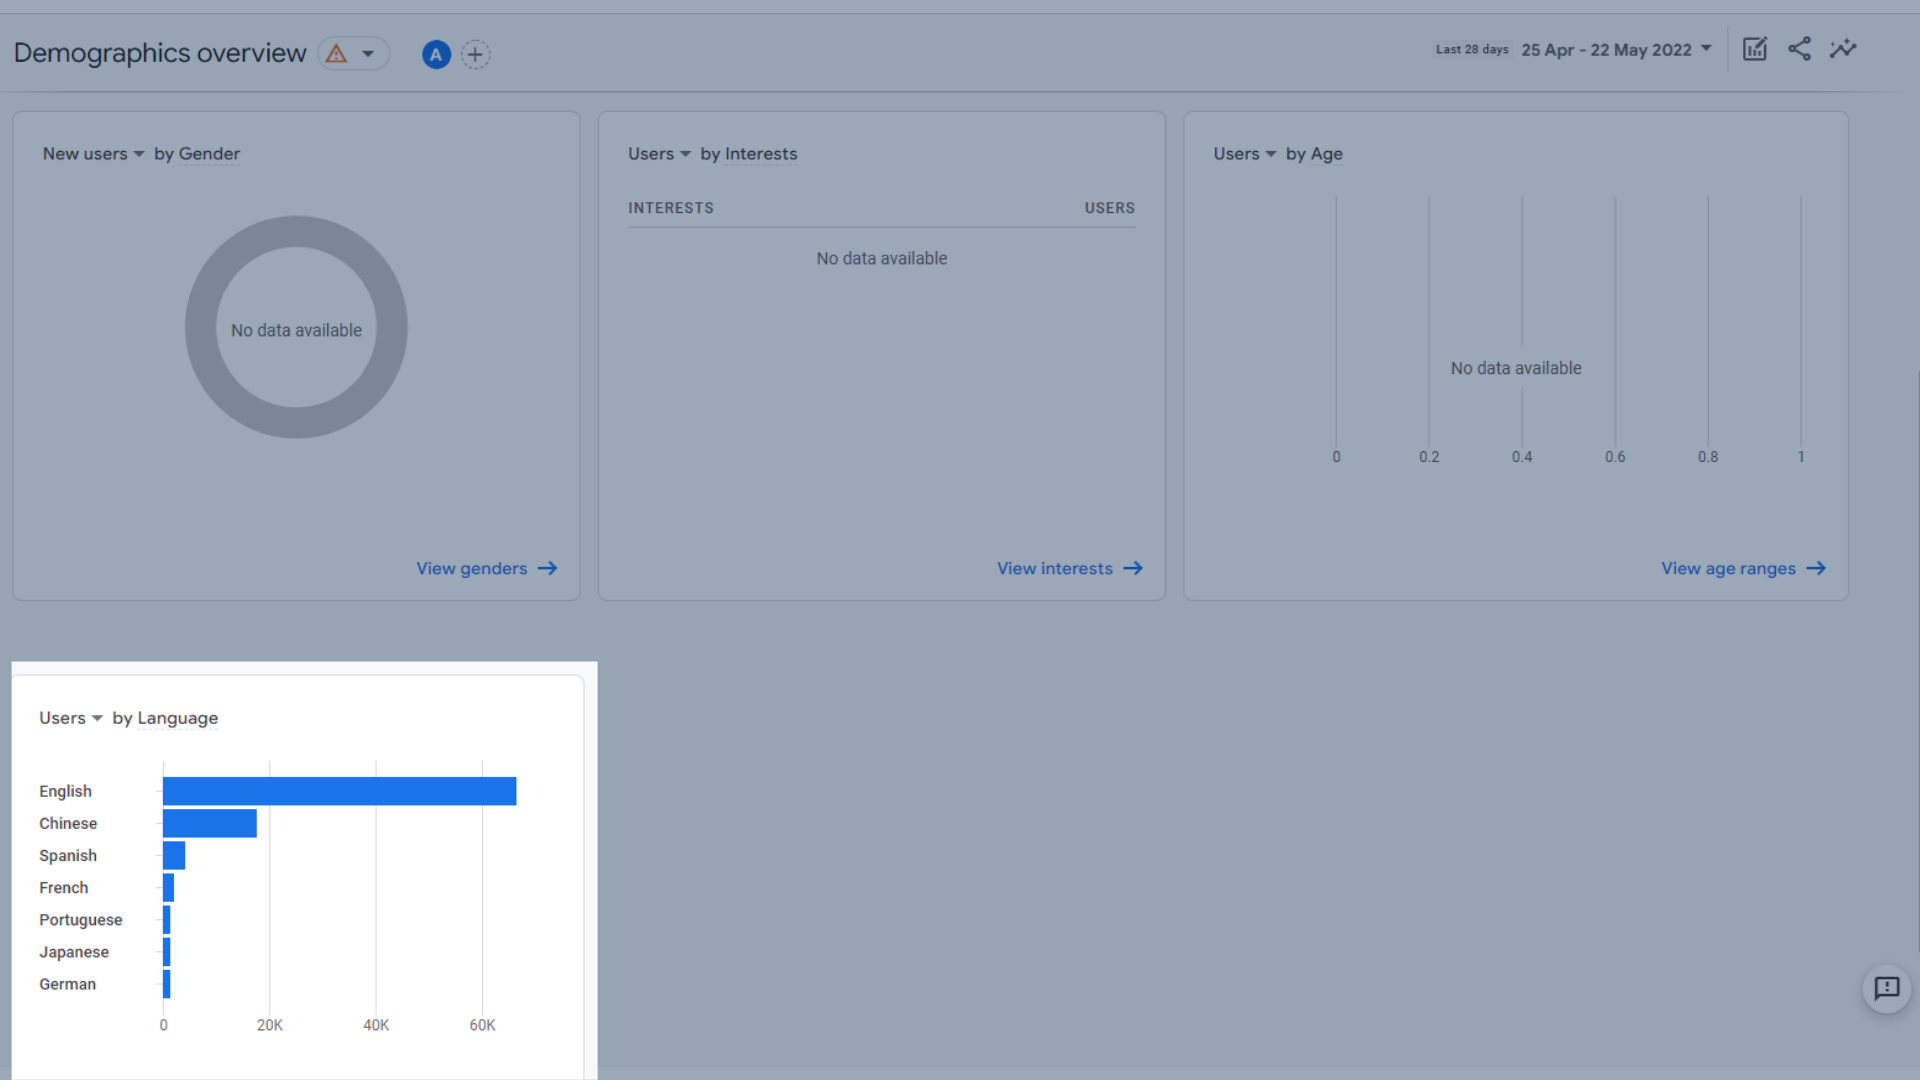
Users by language data
Demographic Details
Here you can see more details about the location of your visitors and their habits. If you click this section in the menu bar, it brings you to the country details by default. If you navigate to it from your demographics overview report by clicking “view X” in the bottom of the panels above, you can view the data for that specific demographic.
Access detailed analytics from the overview page
For these examples, we’ll just be covering the default country details.
It shows:
- Users by country

Users by country chart
- Users and new users by country

Users and new users by country
- Table of users by country and their behaviours
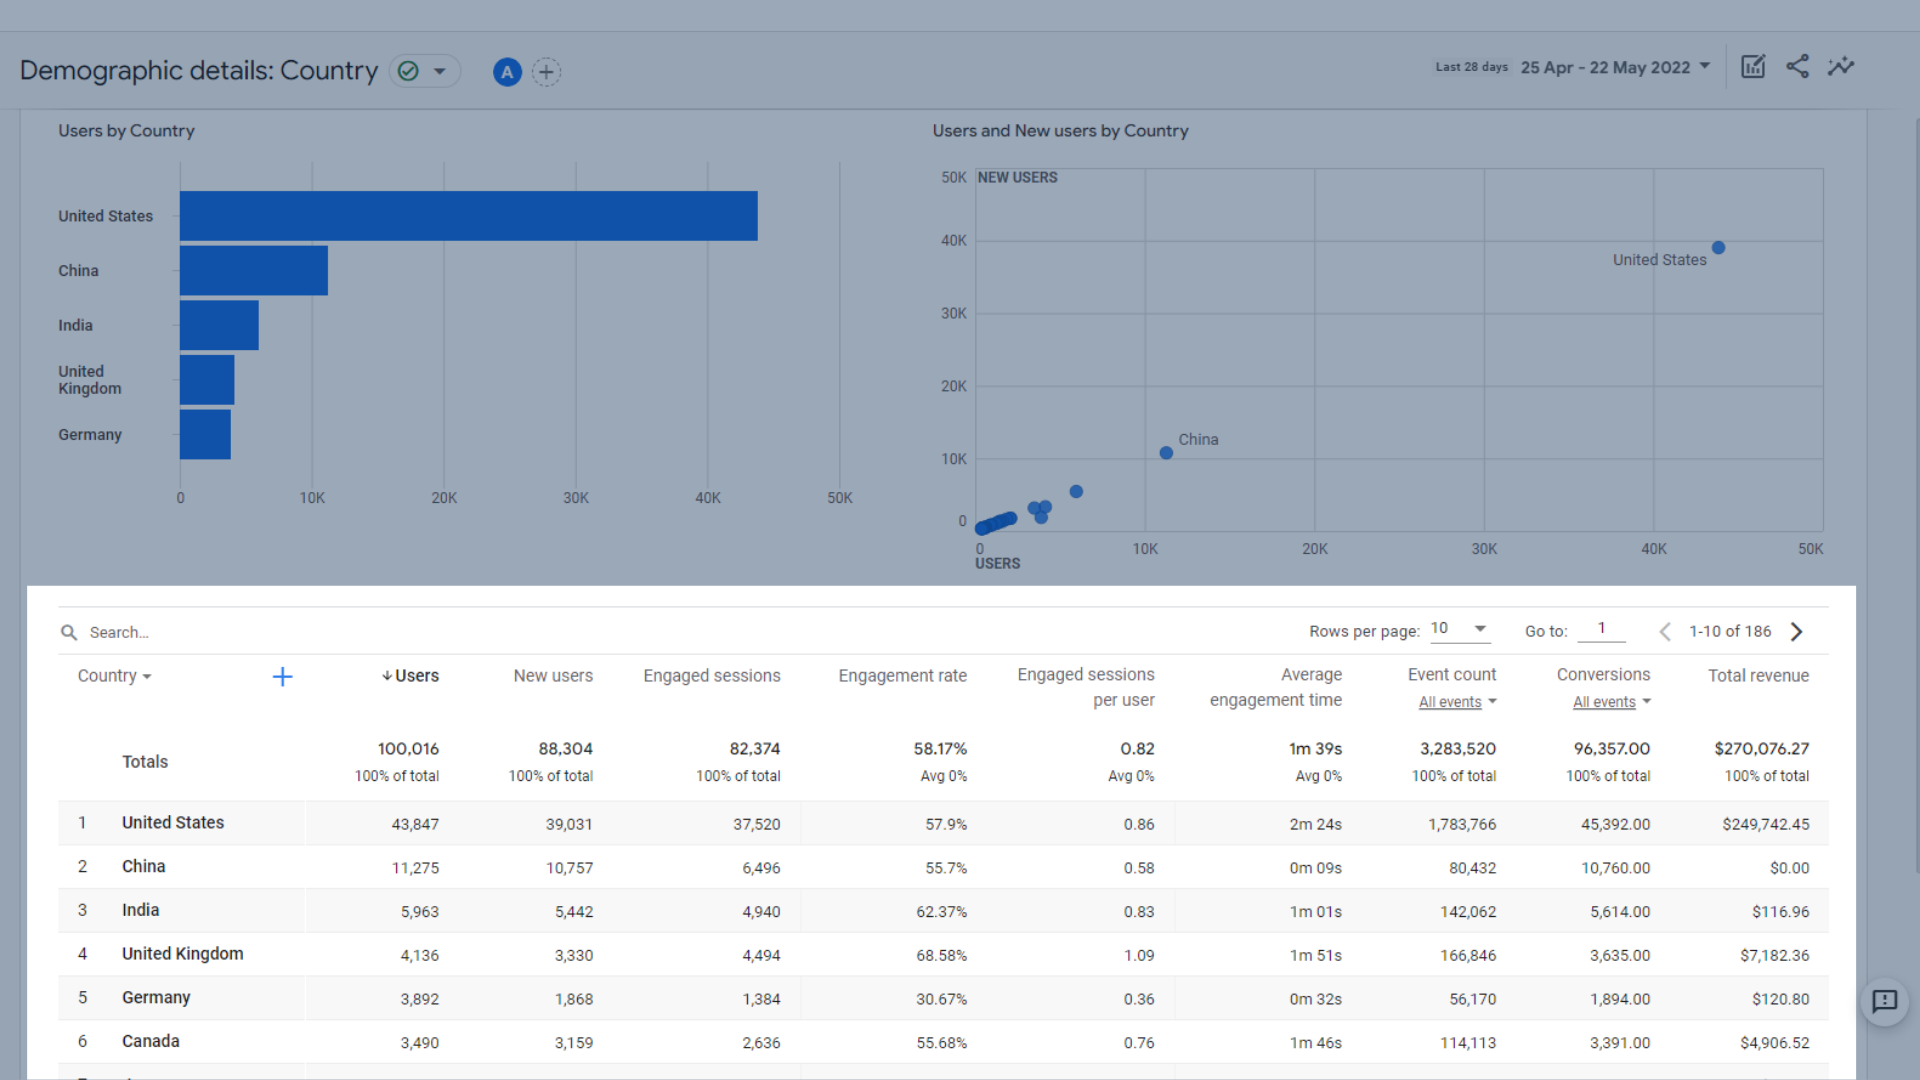
Table of users by country and their behaviours
The definitions for the metrics used here are covered in detail in the life cycle reports section of this guide.
Tech Reports in Google Analytics 4
These reports help you see the device your audience is using to access your website. This is useful for mobile or desktop optimisation. This also helps you see if your app or website is more popular, if you have both.
As Thinkplus doesn’t have an app, these areas will be blank, but they’ll still be in the same place if your GA4 account is connected to your app.
Tech Overview
In this section, some of the data can be viewed by users, new users, returning users or total revenue.
- Users by platform. This will also include app data if you have an app, and shows you how many users have visited each platform. This is useful for comparing app and website traffic.

Users by platform
- Users in the last 30 minutes and their top platforms, comparing web and app users in the last half hour.
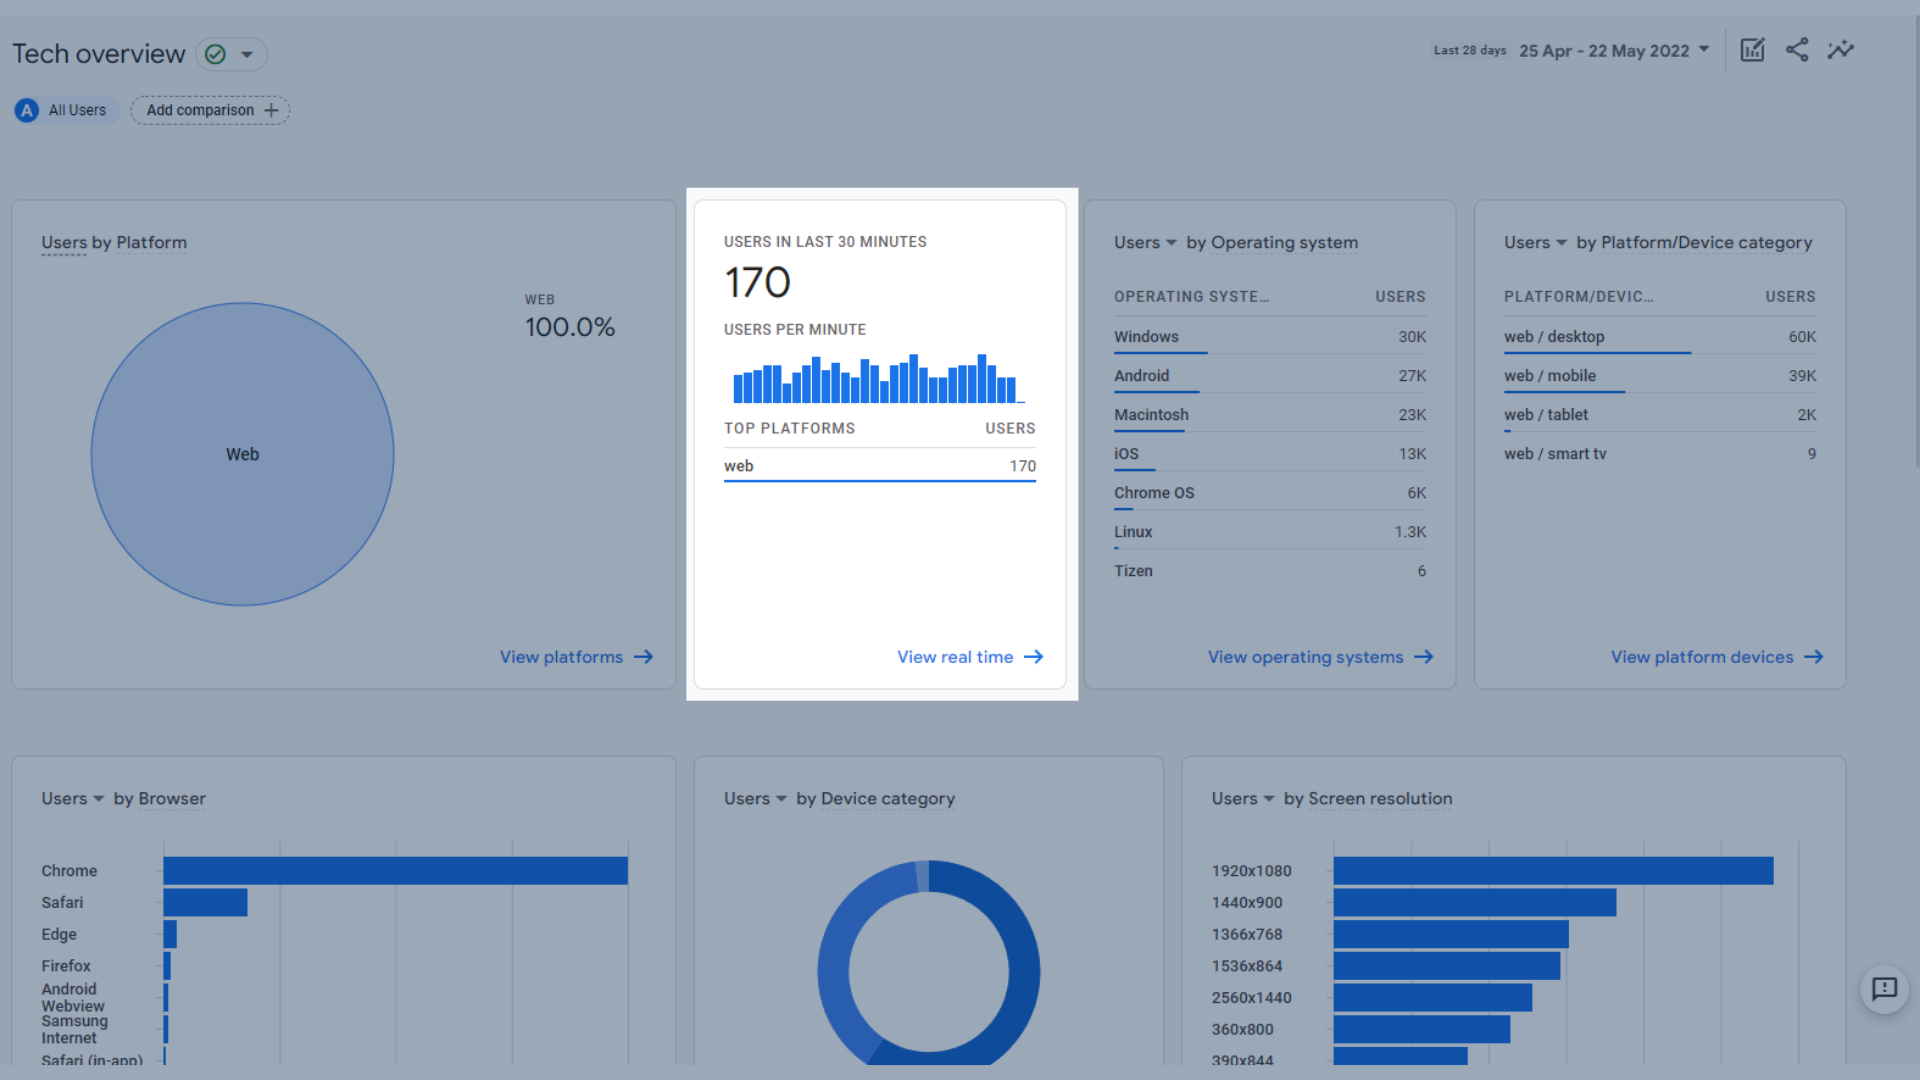
Users in the last 30 minutes by platform
- Users by operating system, showing which operating systems your users have on their device.
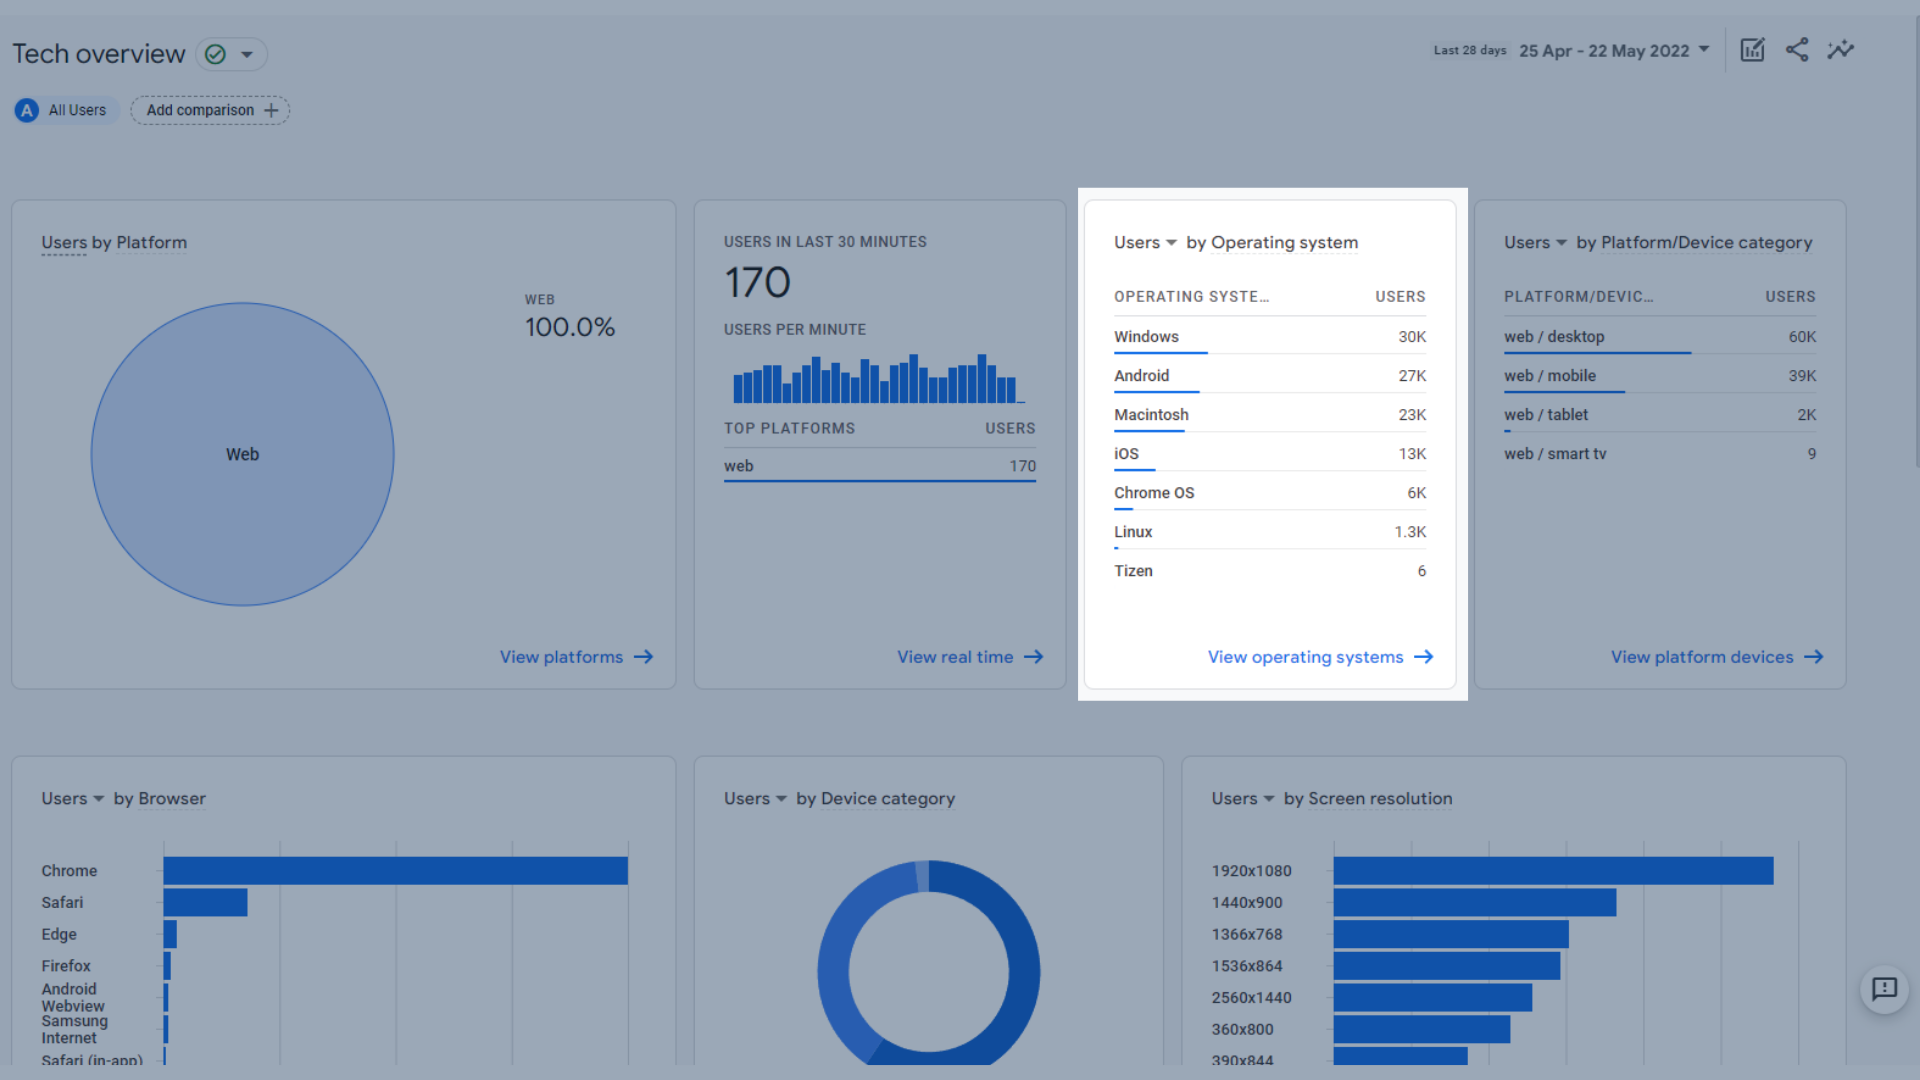
Users by operating system
- Users by platform/device category, such as whether they viewed on web on mobile, web on desktop, app on tablet and so on.
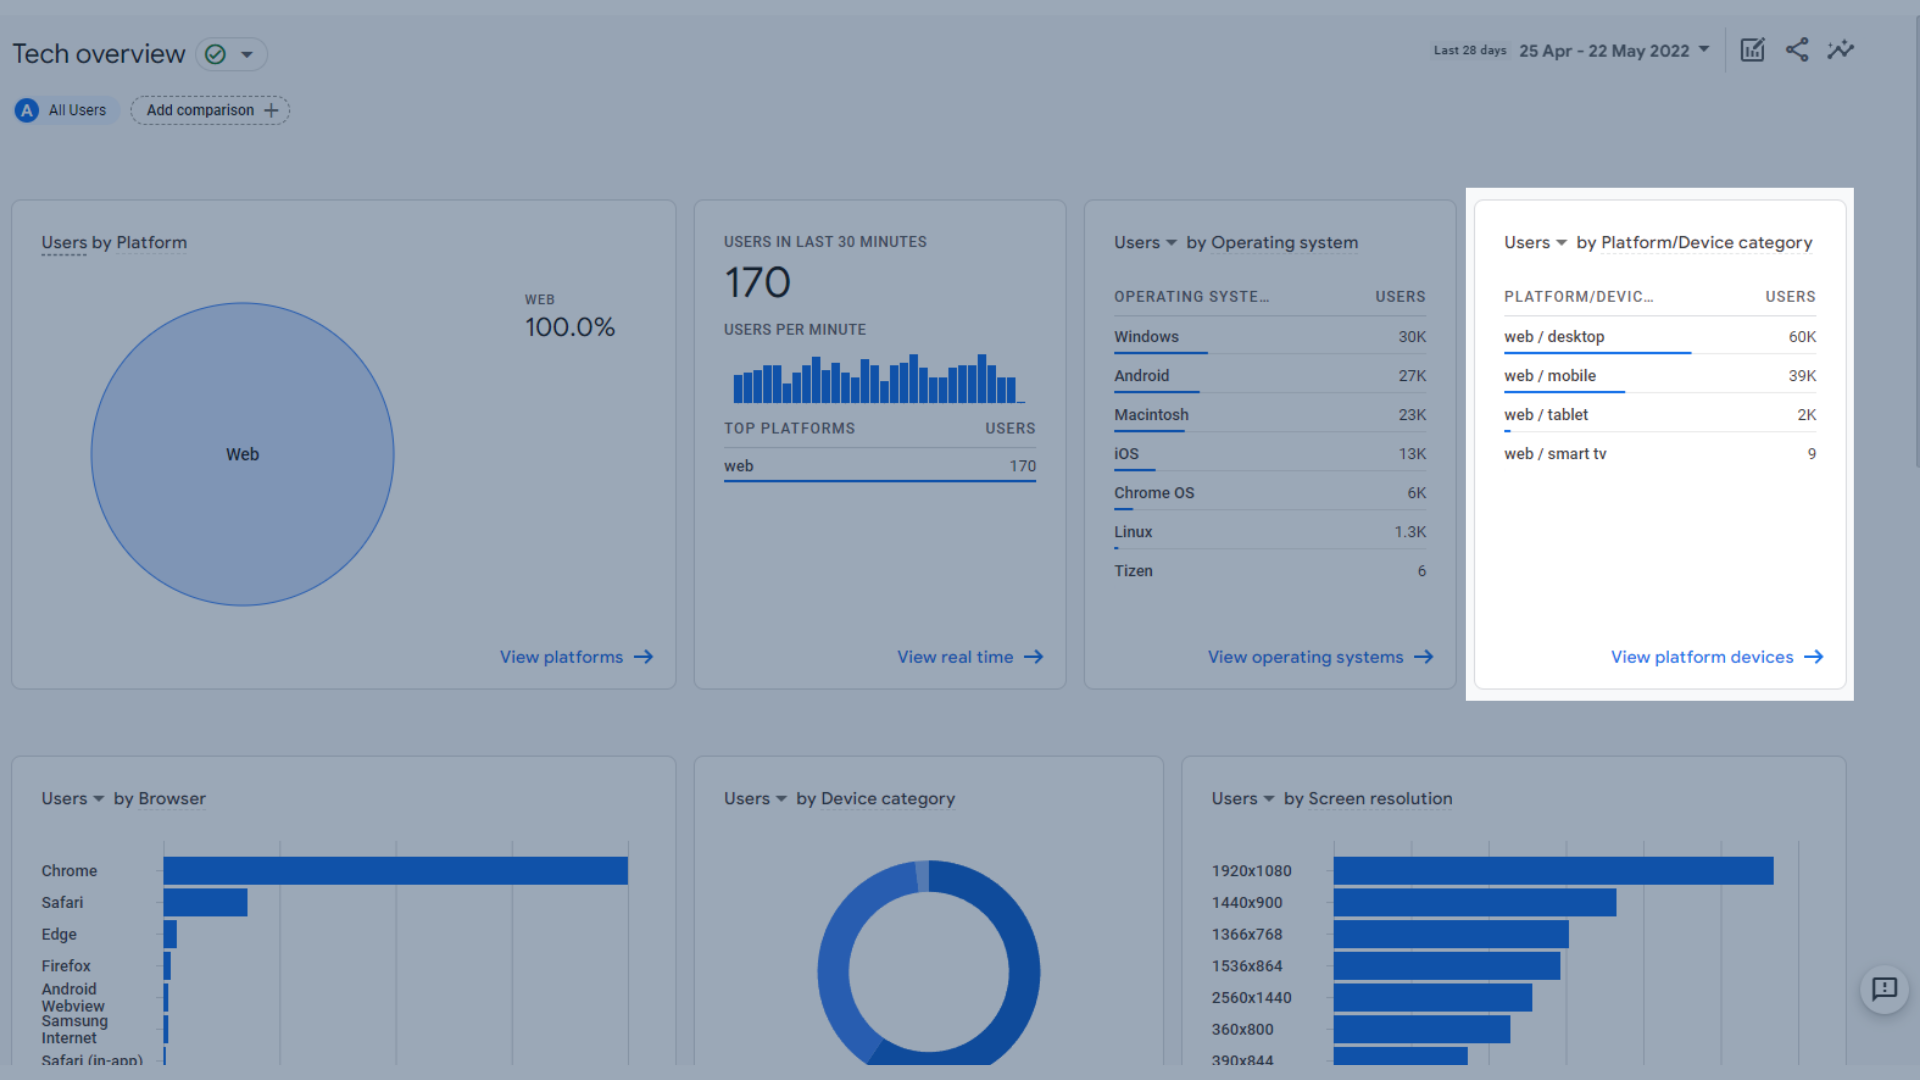
Users by platform/device category
- Users by browser, showing you which web browser your users access your website on.

Users by browser
- Users by device category, showing which device your users visited your site on (desktop, mobile or tablet)

Users by device category
- Users by screen resolution, which is useful for seeing if your website is optimised for your visitor’s most commonly used screen sizes.

Users by screen resolution
- Users by app version, which is important if you’ve recently updated your app to a new version.

Users by app version
- Latest app release overview

Latest app release overview
- App stability overview
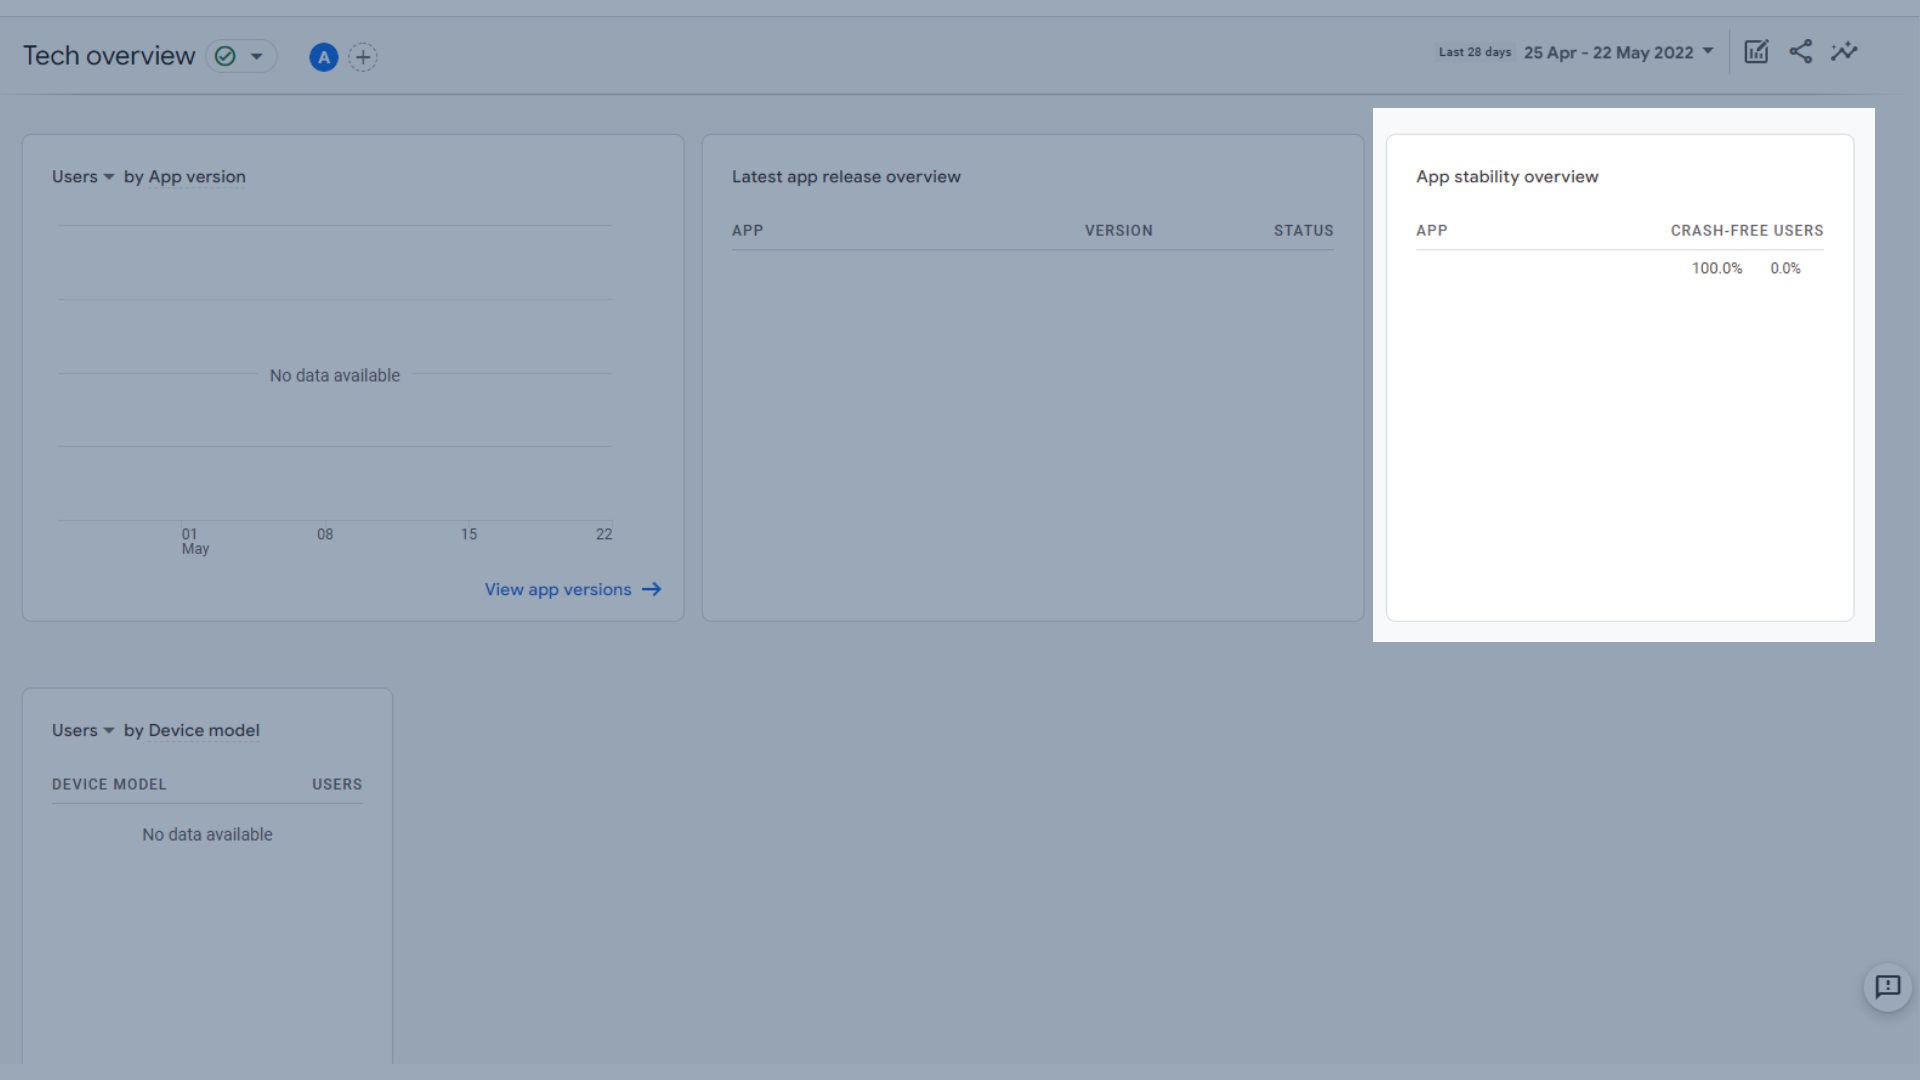
App stability overview
- Users by device model

Users by device model
Tech Details
As with the above, opening the tech details report gives you a default data set to work with, but you can see others by accessing them from the tech overview. The default report is the browser report.
Library
Now we’ve looked at everything above…do you feel like you’ve missed something? Or, do you feel like there’s too much information in your GA4 reports?
Don’t worry. The library has you covered.
The library is used to add or remove reports, meaning you can make your analytics experience perfectly tailored to you, even before we get to the Explore section and custom reports. This means you can customise the reports that appear in your left hand menu.
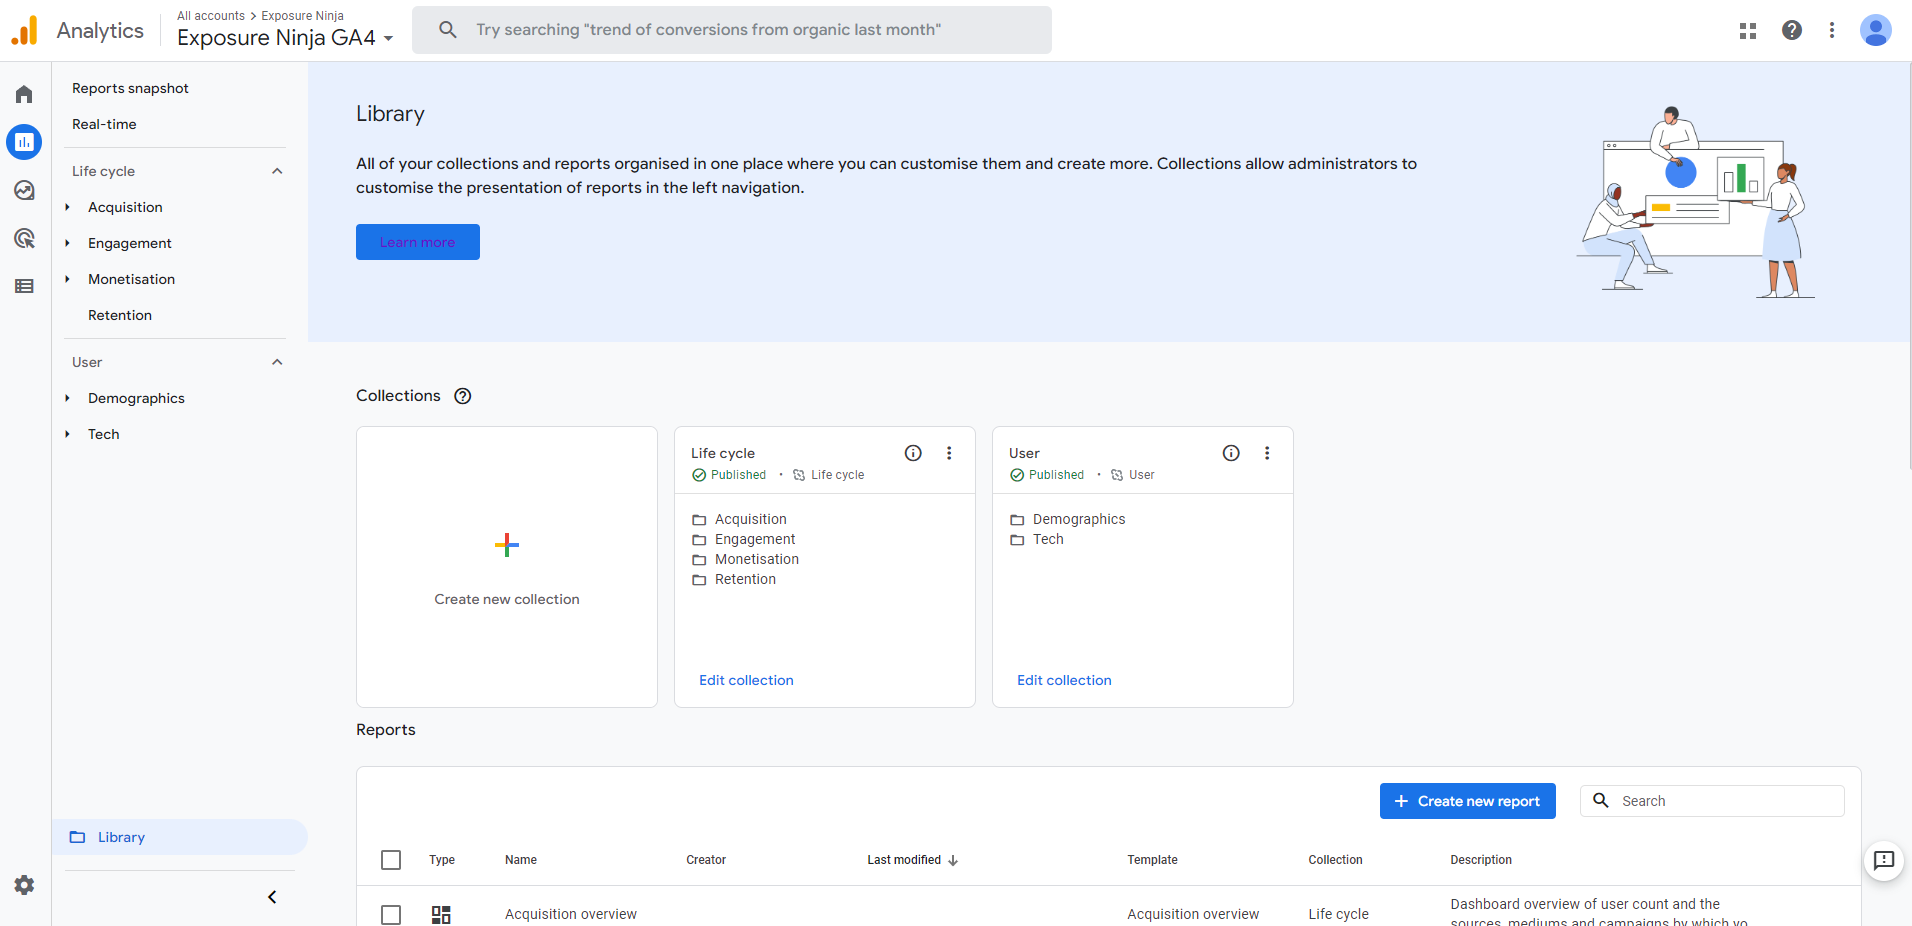
The GA4 Library
So we just took a look at the tech overview report, and found there were a lot of redundant panels as we don’t have an app. We can open this report in the library, and remove the panels we don’t need using the right-hand customise report sidebar. Just click the X next to the data you don’t need to view in your report, and it will be removed.
Alternatively, you can add more cards using the “add cards” button.
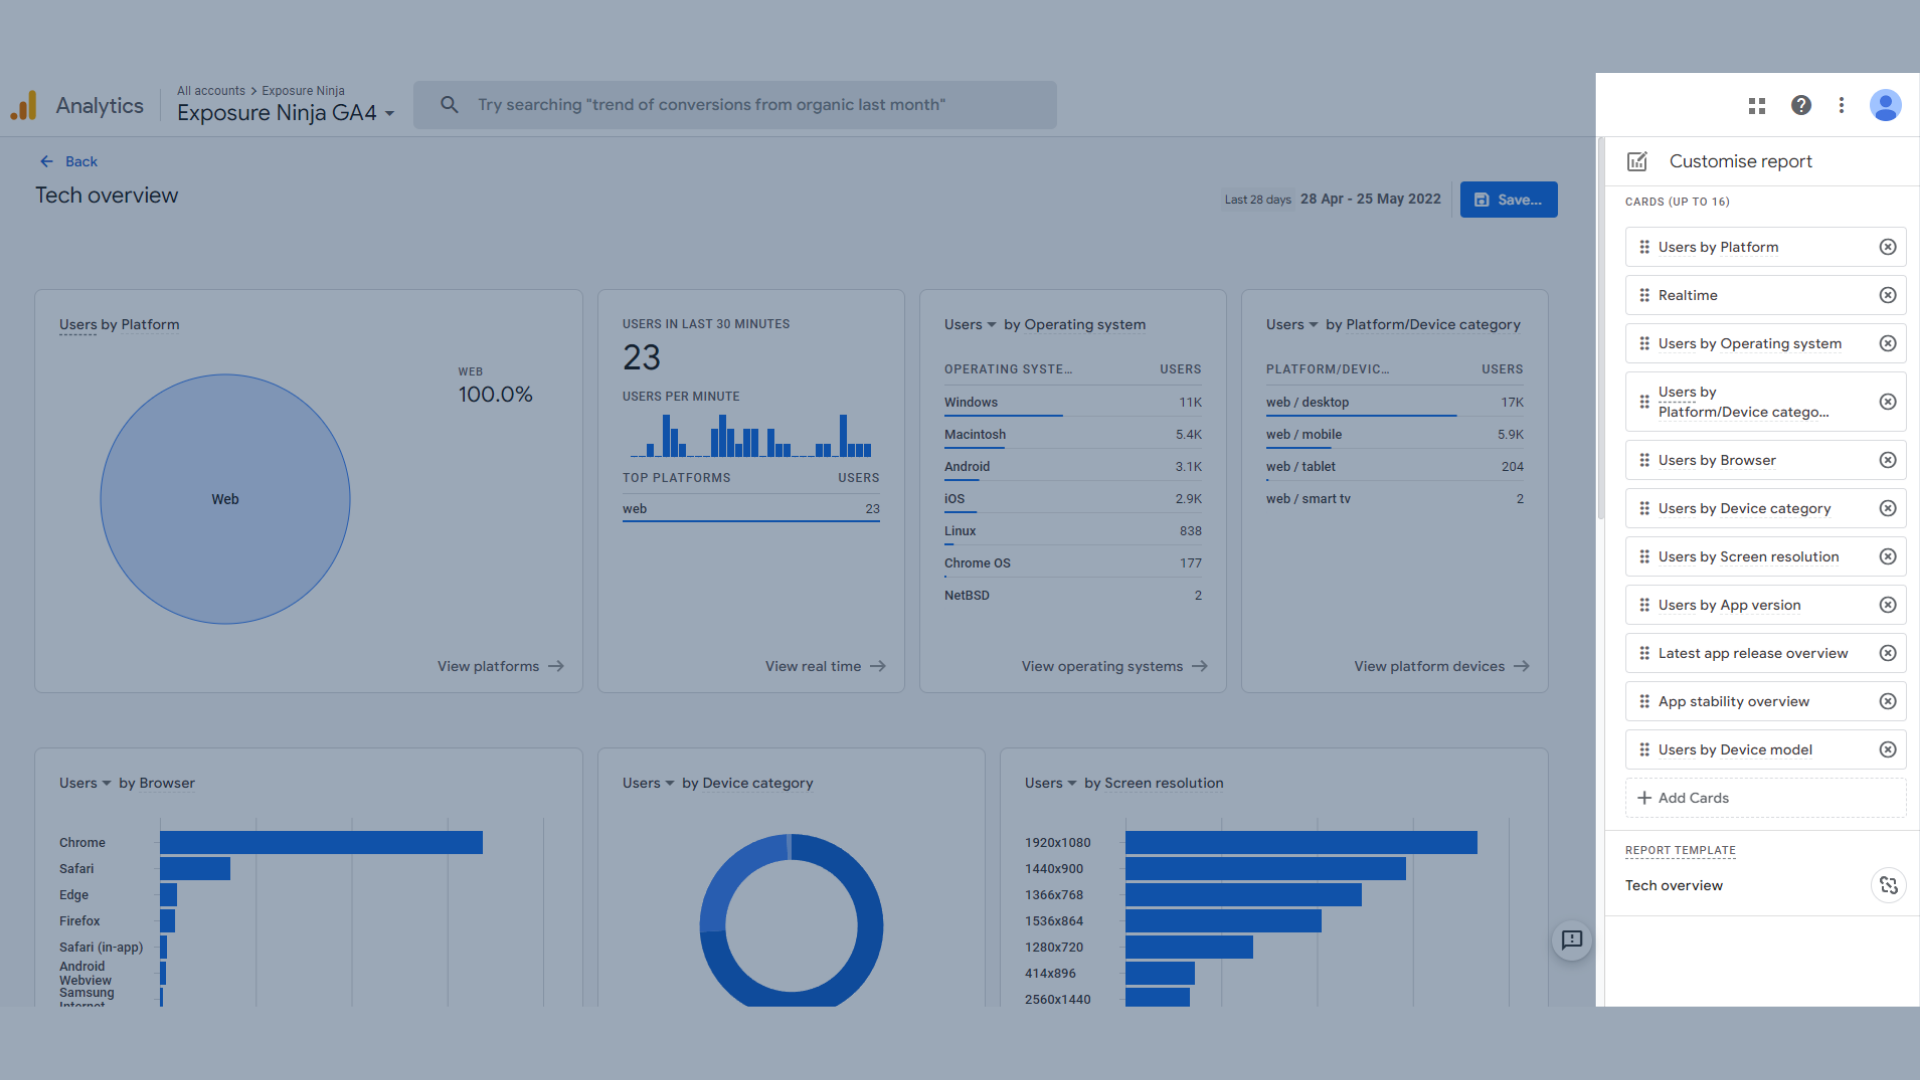
Customise reports using the GA4 library
Struggling to make sense of Google Analytics 4?
Get all the heap you need (and turn the data into revenue-increasing insights) with our free guide.
Building Comparisons in Google Analytics 4
Comparisons are a great way to compare two different types of visitors.
Comparisons are a bit similar to the segments you may have used in UA, but as with most of GA4’s changes, there are a lot of differences. Segments still exist in Google Analytics 4, so stay tuned to find out more about how they work.
The data you view in GA4 reports covers all users as standard. To compare two or more sets of data, first you need to click “add comparison”, which is located at the top of any report.

Location of the Add Comparison button in GA4 reports
That will then open a menu to your right which is where you can build your comparison.

The build comparison window
There are different types of comparisons you can make.
You can either include or exclude dimensions from the following categories for your comparisons:
- User
- Device
- Page/Screen
- Acquisition
Let’s say you want to see if your UK audience behaves differently to the rest of the world.
You can select “include > country > UK” and then hit the apply button.

Build comparison – “Country includes United Kingdom”
Now we can see orange data which shows us the activities of users from the UK.

“Country includes United Kingdom” comparison report
But let’s say we want to be more niche than that.
We can also compare the number of users in the UK who are located in London.

Build comparison – users in London
We now have a second comparison in our report which shows a more niche audience.

“City includes London” comparison report
But what if you don’t want to see all users, and just focus on your UK visitors from the entire UK and London? Or, what if you want to go back to looking at all your users alone?
You can easily remove any comparison by clicking the “X” icon next to its name in the top left, or by using the little graph and pen icon (highlighted in the image below) and clicking the three dots by the comparison you’d like to remove, before selecting “remove comparison”.
You can also use this menu to edit any of your comparisons, or to create a new comparison using the selected comparison as a template.

Remove a comparison
Once you’ve created a comparison in one report, it will follow you to other reports, so you don’t have to set it up each time.
Event Tracking in Google Analytics 4
One of the main changes when it comes to Google Analytics 4 is the way that data is collected.
In GA4, the different actions a user takes on your website are now all called “events”, and it’s up to you to decide what you want to track on your website. Some will be automatic, some are recommended, and some may take a bit more setting up if you want to make them even more custom.
This way, you’re only seeing the data you want to see, that’s more relevant to you and your business. This does require more thought on your part, but will save you some headaches in the long run when new technology and devices come about.
Events work by setting up a combination of different tags and triggers in Google Tag Manager. The nature of these tags and triggers is entirely based on your business.
To add or remove events, head to the configure page in the left hand menu.

Location of the configure page
You will automatically land on the events page, which shows you all the events you have set up on your website.
Here you can add new events, modify existing events, or delete events you no longer want to track.
As you can see, some of our events are also marked as conversions. Many GA4 users prefer to create events and then mark them as conversions rather than building conversions from scratch. We’ll cover how to make conversions from scratch later in this guide.

Examples of events, with some marked as conversions
Automatically tracked events
There are some things that GA4 needs to collect, such as session start time and pageviews. These are already set up for you within GA4, and can’t be changed.
The events set up automatically are:
- First_session – the first time a user visits your site
- Session_start – when a user starts a session on your site
- User_engagement – when the user spends 10 seconds with the page active (visible on their screen, minimised or in another tab don’t count), or views 2 or more pages, or triggers a conversion event (has to be a conversion event, not just an event)
Enhanced measurement
Enhanced measurement gives you even more information about your website visitors, such as how far they scrolled down your pages, (scroll depth tracking), if they downloaded a file or if they engaged with a video on your site.
You can find more examples of Enhanced Measurement on the Google Support page.
In UA you had to use Google Tag Manager to add these types of events, but in GA4 you can set up these events within Google Analytics rather than needing to head to Tag Manager.
To find the advanced measurement section in Google Analytics 4, you must head to the Admin screen.
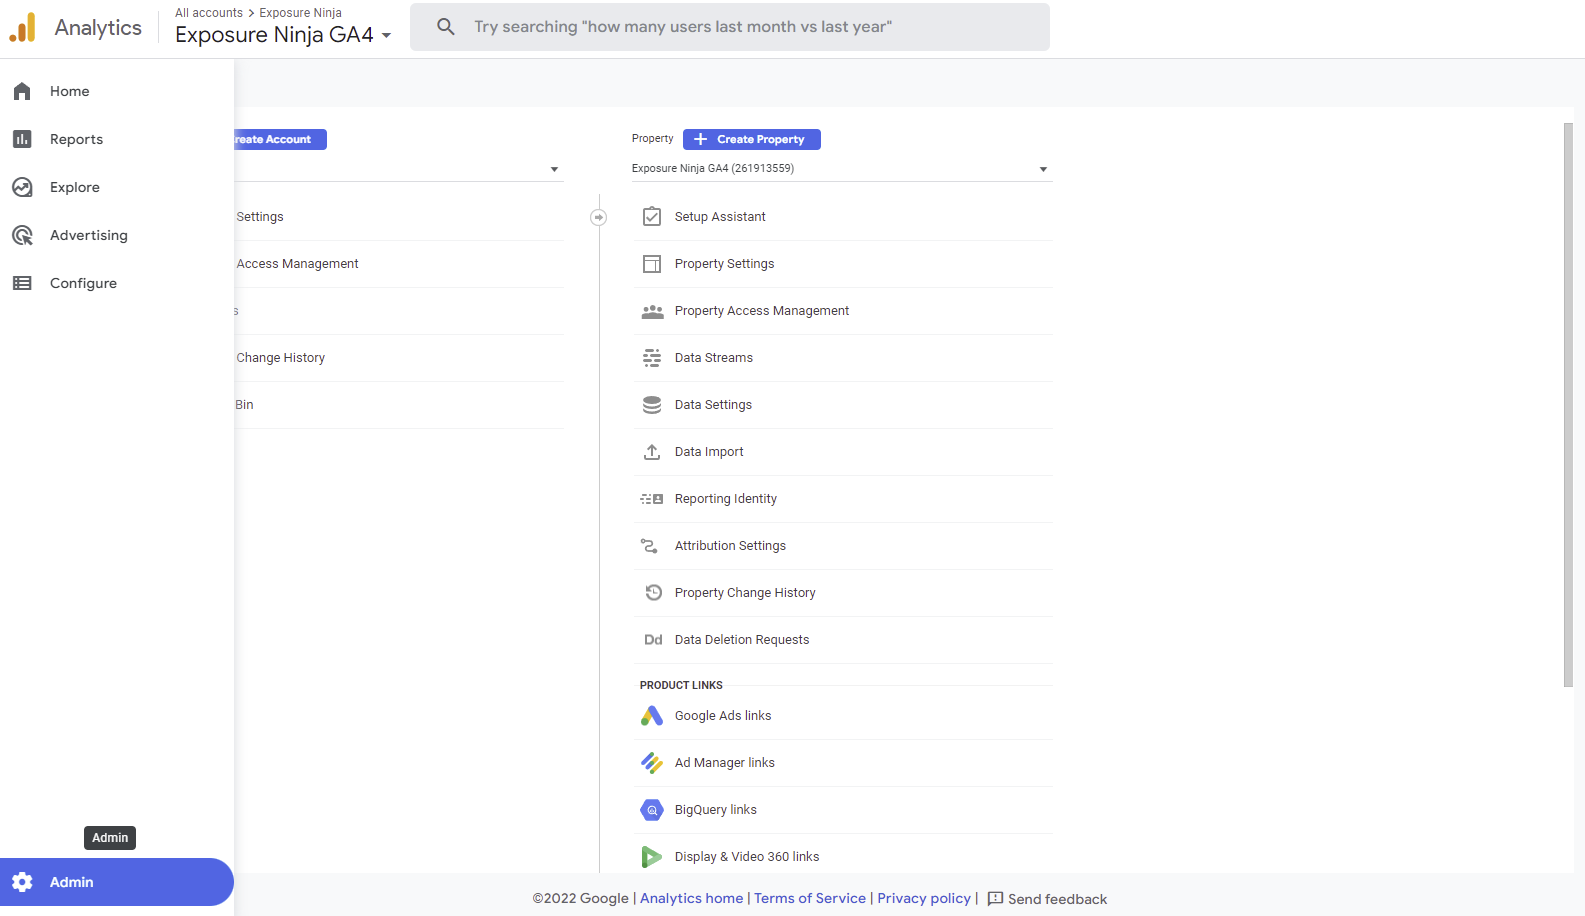
Locate the admin screen
Then, you want to head to data streams in the second column.

Data streams
Click on your website’s data stream to bring you to the web stream details. This is where you will find the enhanced measurement options.
If you click the cog on the right side of the enhanced measurement box, you can toggle your advanced measurements on or off.
Here you can add or remove tracking for:
- Scrolls, which captures scroll events each time that a visitor gets to the bottom of a page.
- Outbound clicks, which captures outbound click events each time a visitor clicks a link that leads them away from your domain.
- Site search, which captures a view search results event each time a visitor performs a search on your site.
- Video engagement, which captures video play, progress, and complete events as visitors view embedded videos on your site.
- File downloads, which captures file download events each time a link is clicked with a downloadable document, compressed file, application, video or audio extension.
You can configure some advanced settings here too, but as this is a beginners guide we won’t overwhelm you with this.

Enhanced measurement options
Let’s test our events with the debug view. This gives us the chance to check our events are working, without interfering with the main site’s data.
First, head to Google Tag Manager and head to the tag page. Click the preview button and enter your website’s URL, like we did while setting up GA4.
Once your debug page is up and running, complete some actions that will fire off the events we just configured. We are going to scroll to the bottom of the Thinkplus homepage to fire off the scroll engagement enhanced measurement.
To see if the events have worked, you need to check the debug view.
You can find the debug view on the configure page menu.
Right now, this is empty, as we haven’t completed any events.

Debug view in GA4 with no events
Once we’ve scrolled to the bottom of the page, we can see that the scroll event has been triggered.
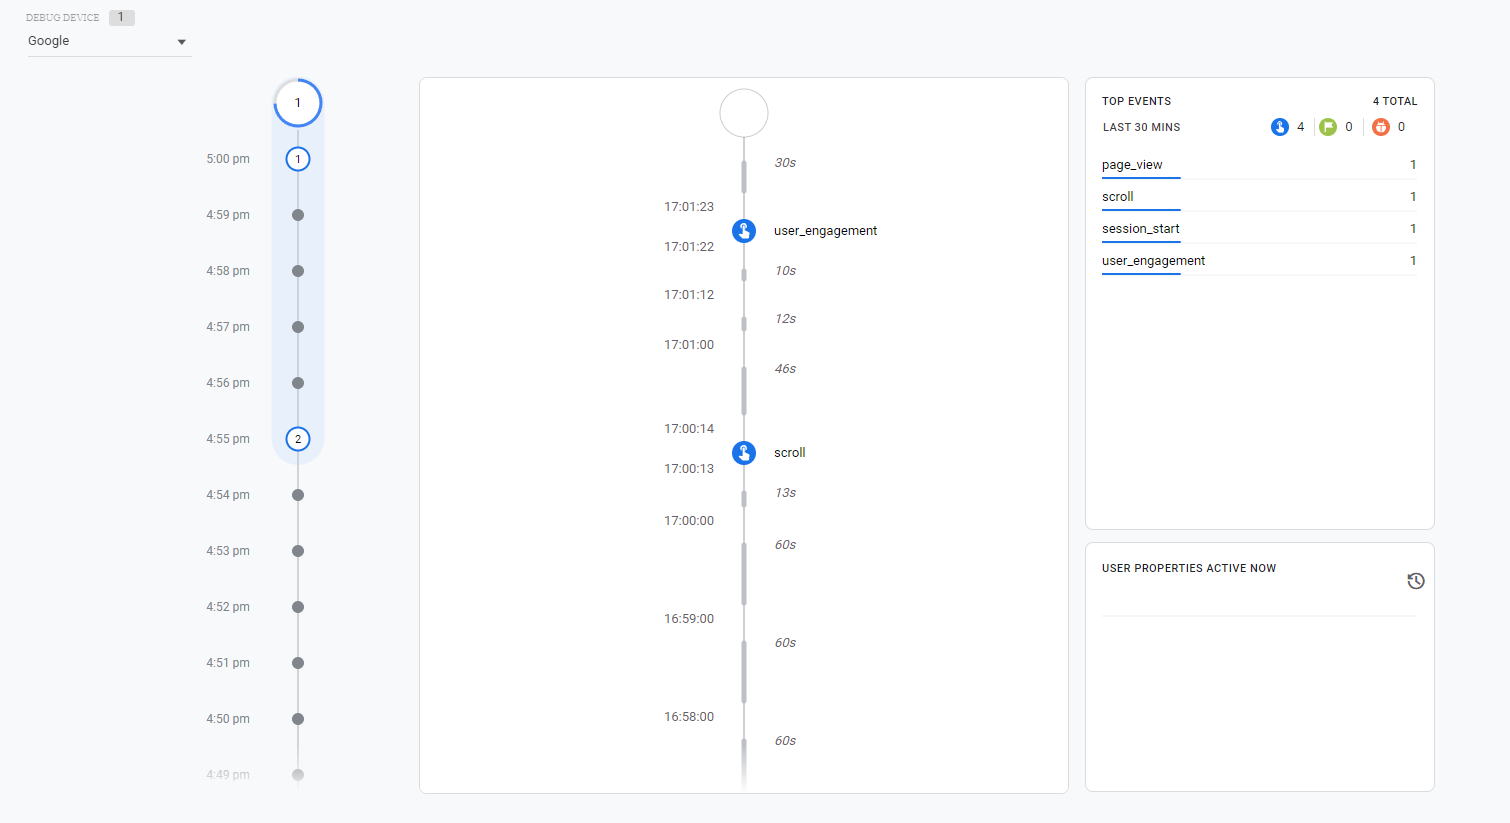
Debug events triggered
Google Tag Manager Events in GA4
These events need to be set up using Google tag manager, so you may need to speak to a developer if you’re not so confident with this. We’ve included a tutorial below if you’d like to set them up yourself.
Recommended events
These are events that you will need to set up in tag manager, but Google helps you by suggesting recommended names for these events. Some of these events include login, where you track when a user logs in, search, when a user searches your content, or share, when a user shares content.
You can see an extended list on Google’s support page.
Custom events
Custom events are totally custom, and are not set up automatically when you move to GA4. Google advises you of naming conventions, but doesn’t enforce it. They advise all lower case and use underscores for spaces (eg contact_form_submission), and you have a limit of 40 characters for the name.
Get to the top of Google
Learn how to get your website to the very top of Google (and turn that traffic into revenue).
How to set up GTM events in GA4
So, how do you set up the above events in Google Tag Manager?
Let’s have a look at the recommended event, login
Head to GTM, select the tag page in the menu, then click new

Set up a new event for GA4 in Google Tag Manager
On the tab that pop’s up, click “tag configuration”, then select Google Analytics: GA4 Event.
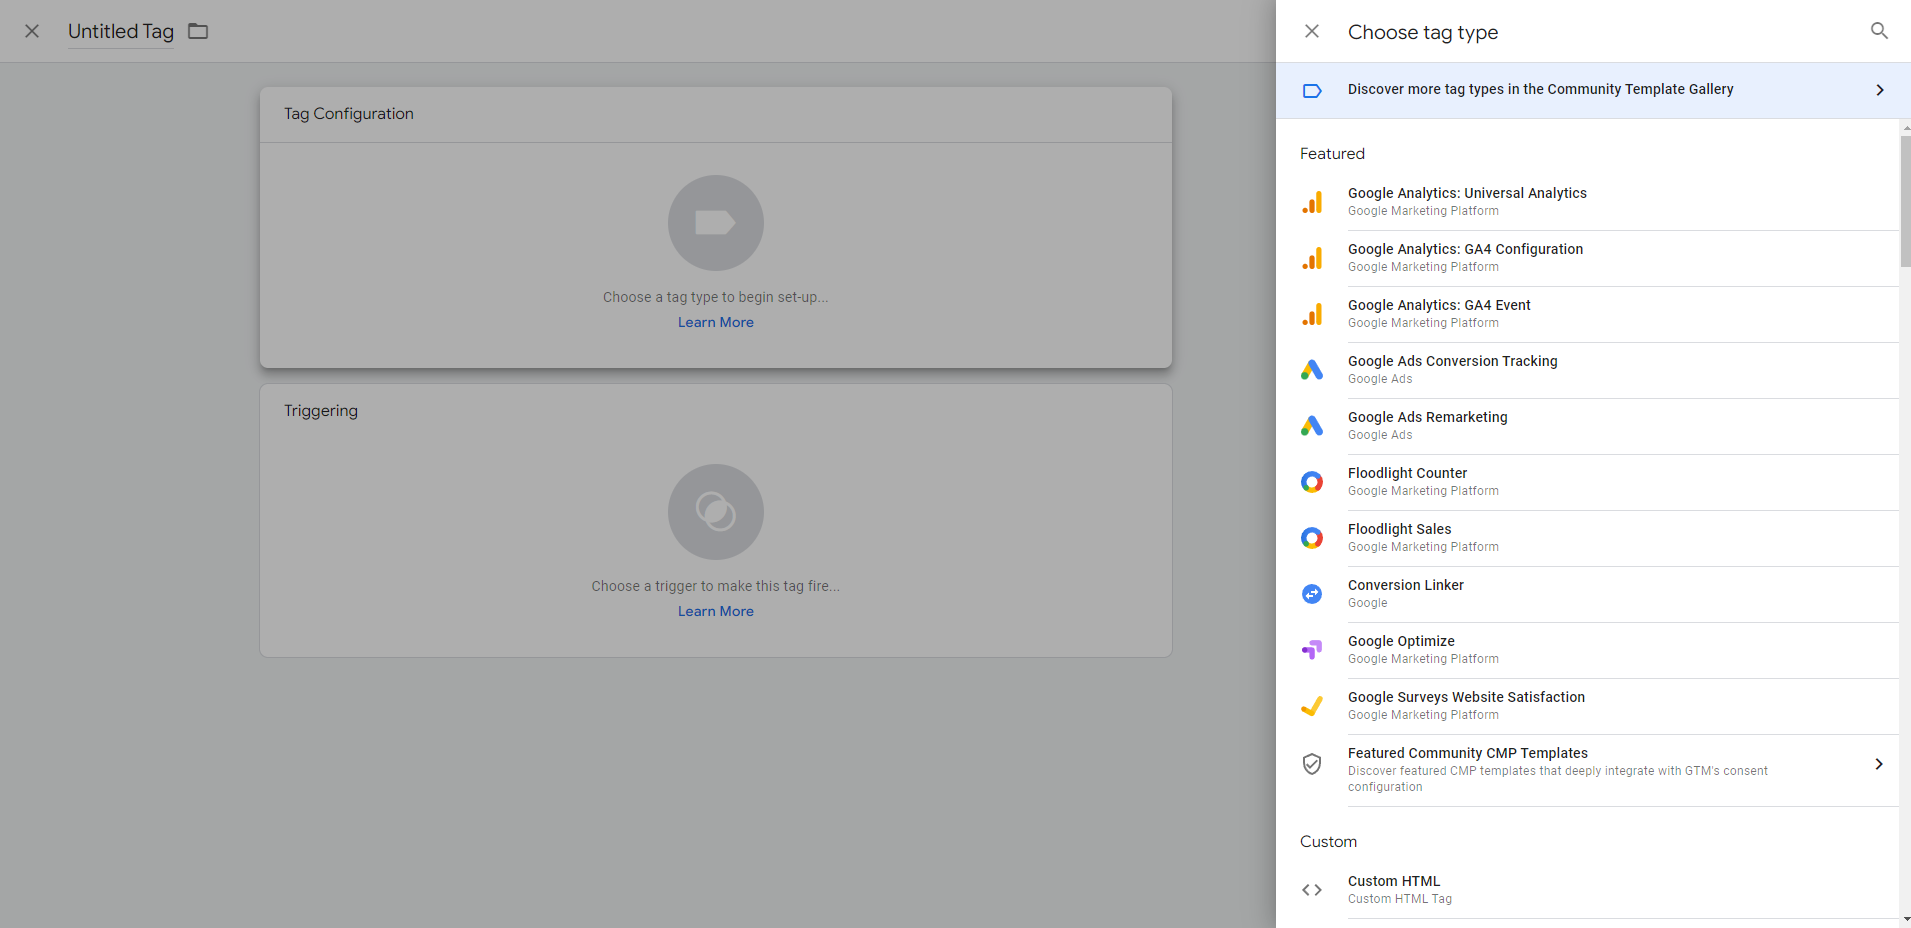
Tag configuration in GA4
Next, select your Configuration Tag, which is the same as your existing GA4 config tag that we set up earlier. For us, it’s called GA4 Tag. Then name your event for recommended events, make sure this is exactly the same as the name Google gave this recommended event.
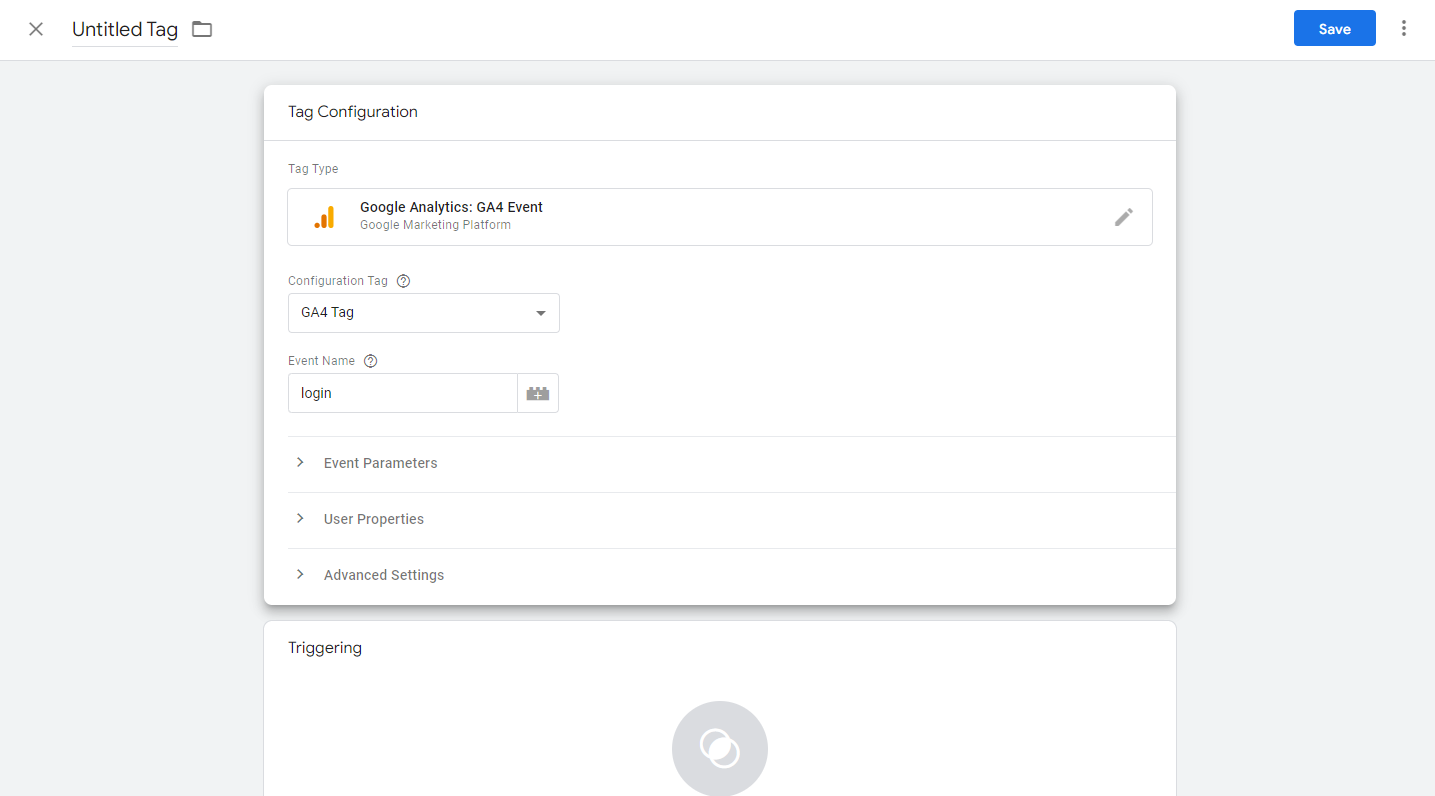
Add details to your GA4 tag in GTM
Next, use the box below Tag Configuration, called Triggering, to set up the trigger. Click the box to open the “choose a trigger” window, then use the blue plus button in the top right corner to create your new trigger.

Choose a trigger page in GTM
Click the Trigger Configuration box, and then select “Custom Event” from the other section of the tab that pops up.

Choose trigger type in GTM
Add the event name should be the same as the name Google recommended. Give it a name in the top left to help you identify it later. We’ll go with “recommended – login”, then hit save
This will take you back to the first screen, where you can name your custom event and save.

Save your recommended event in GTM
Don’t forget to use the debug view to check that your recommended event is working.
You can also add custom parameters to your event. This is useful for login if you have a few different login methods, for example, users can login via Facebook or Google.
Head back to the recommended details page, and look at the available parameters.

Recommended event parameters
The parameter name here is “method”. Copy this and paste it into the parameter box in your tag in GTM.

Enter parameters in GTM
In the value box, you enter your value, so in this case it could be “email” for those who login using their email, or “Facebook” or “Google”. Then save and test, as always.
To view this method parameter in your reports, you must set it up as a custom dimension, which we’ll cover in the next section.
This video gives you more detail about how to set up events, including recommended and custom events. Custom events are more complex, so we won’t be covering them in this beginners guide.
Get more from your events with custom definitions
Adding your events as custom definitions in GA4 means that you get even more data about the actions your users take on your website. This is something you may miss if you’re moving from UA.
For example, if you’re selling online courses like Analytics Mania, you may want to track sales based on the difficulty of your course. This isn’t the type of thing Google would include in GA4 as standard is it’s not commonly used.
This is more advanced, but may fill a gap if you’re confused as to where this data went if you’re moving from UA. If you are one of these people, check out the video below.
How to configure and track conversions in Google Analytics 4
In UA, you would set up goals to track conversions, time spent on the website, pages/screens per session or events, such as video views.
In Google Analytics 4 however, conversions are tracked simply as conversions, under the configure tab.
This is also where you set up your events, which you can actually mark as conversions.

Location of the configure page in GA4
Click the configure button, which will automatically open the events page. Select “conversions” to see all your conversions, or create new ones. Depending on your business, you may be tracking more or less conversions than us, which is completely fine.

Example of conversions
Predefined conversions
Events in GA4 that are automatically set up as conversions when you create a GA4 account are as follows:
- purchase (web and app)
- first_open (app only)
- in_app_purchase (app only)
- app_store_subscription_convert (app only)
- app_store_subscription_renew (app only)
As we only have a web data stream, and not an app, purchase was set up automatically as a conversion. You can see in the screenshot before that we cannot turn off purchase as a conversion, but we can toggle the events that we have marked as conversions.

Predefined conversions and events as conversions
Track events as conversions
If we head back to the events page, we can see these same custom conversions there as events, with the mark as conversion option on. If you have an event that you want to track as a conversion, simply toggle the “mark as conversion” button to on, so it shows up as blue, and now that event is being tracked as a conversion.
These events will not be tracked as conversions until you toggle them on, so you won’t see any retroactive data.

Events marked as conversions
New conversion events
Events will only show up in your event tab in GA4 if they have been triggered on the site. So if the event hasn’t been triggered yet, you’ll need to manually create it as a conversion regardless of how much time since you set it up .
First, set up your new event. Then, head back to the conversions tab and click “new conversion event”. In the new event name box, enter the exact same name you gave your new event.

Add new conversion event in GA4
As always, don’t forget to test your new conversion in the debug view.
How to view conversion data in GA4
Once you’ve set up your conversions, you can head to your conversions view to view them, or view them in other tables by clicking the small downward arrow next to Conversions – all events on a table and select it from the drop down menu.

View your conversion in the drop down menu
Struggling to get all your marketing done?
Download our marketing priority planner and get your marketing back on track.
Creating Custom Reports in Google Analytics 4
Creating custom reports in GA4 is very different to how you would in UA.
The explore section in GA4 is the area you use to create your own custom reports. You can choose from multiple templates and customise every part of your reports.
Your reports are made up of different types of “exploration” – this is essentially the way the data in your report is reported. So you may choose a funnel style exploration, or a path exploration. You can combine more than one type of exploration in a report.
Since this is a beginners guide, we’ll be looking at reports on quite a basic level. The best thing you can do is open up your own GA4 account and mess around with the reports and try out different explorations. Your reports won’t affect your existing data, so if you make a mistake you can just delete your report and start again.
If you prefer, you can export the data to Google Data Studio and create your reports there instead.

The Explore page for custom reports
You can start a report using a blank exploration or a template. There’s also a template gallery where there are even more template types.
Today we’ll look at three popular exploration templates – free-form, funnel exploration and path exploration.
So what is standard across all these reports?
You have variable and tab settings which appear on your report, no matter which exploration template you choose for your report.
Report settings
The variables column is where you select the elements you want to include in your report’s exploration. To start with, they won’t all be visible, so you will need to add them manually by clicking the cross next to the type of variable you want to add, e.g. dimensions, and then selecting the variable you want to add.
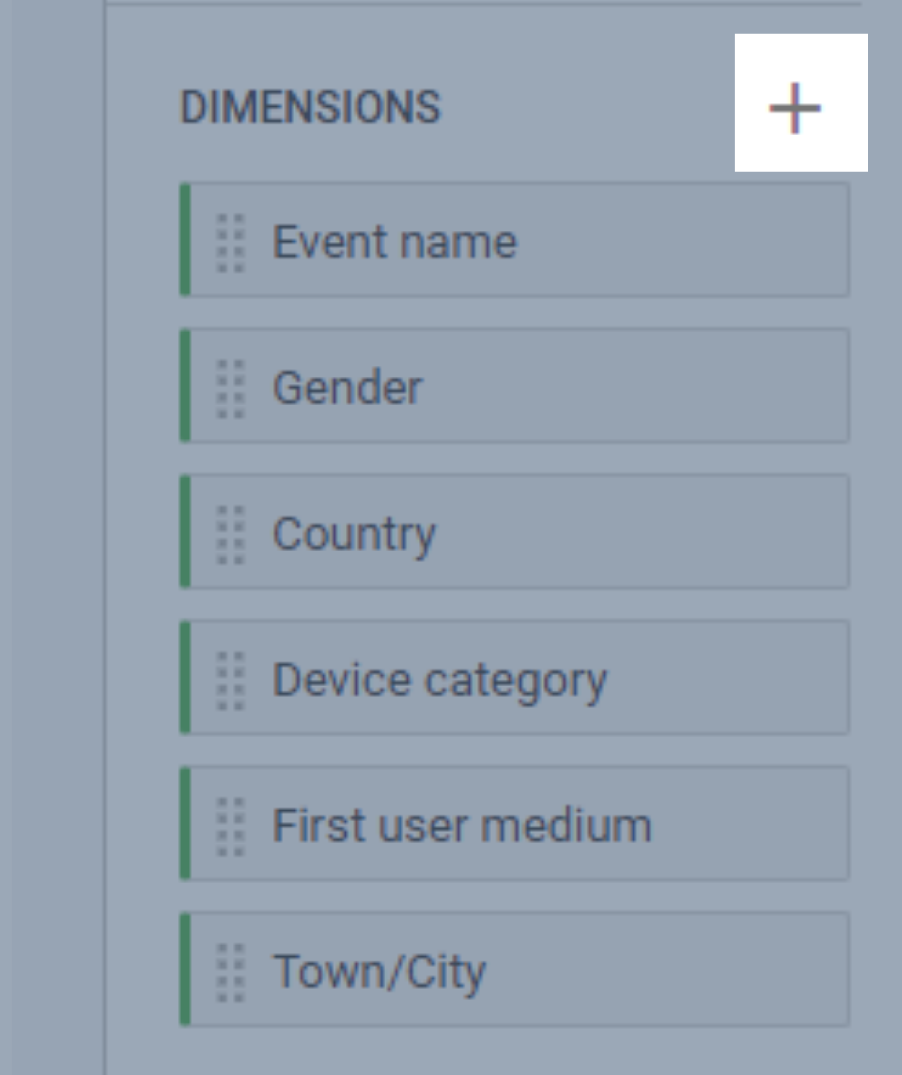
Add variables to your custom reports
Yes, this sounds like more work, but really, if you don’t want to track certain things, like app related data, then you don’t have to scroll through all the app related variables to get to the ones you actually want to use in your custom reports.
For example, at Thinkplus we don’t need to track game data, as we don’t have a game app to track.
Let’s say we did add a game (Shinobi Smash anyone? Every time you get annoyed at something in GA4 you play as our Shinobi and fight Google? No? Ok), then we could easily check these boxes and add this data into our custom reports.

Select dimensions in custom reports
Tab settings are what allow you to have different exploration styles within one report – you can have multiple tabs in your report, each with their own type of exploration. Each type has slightly different settings, and these will change depending on which you select.
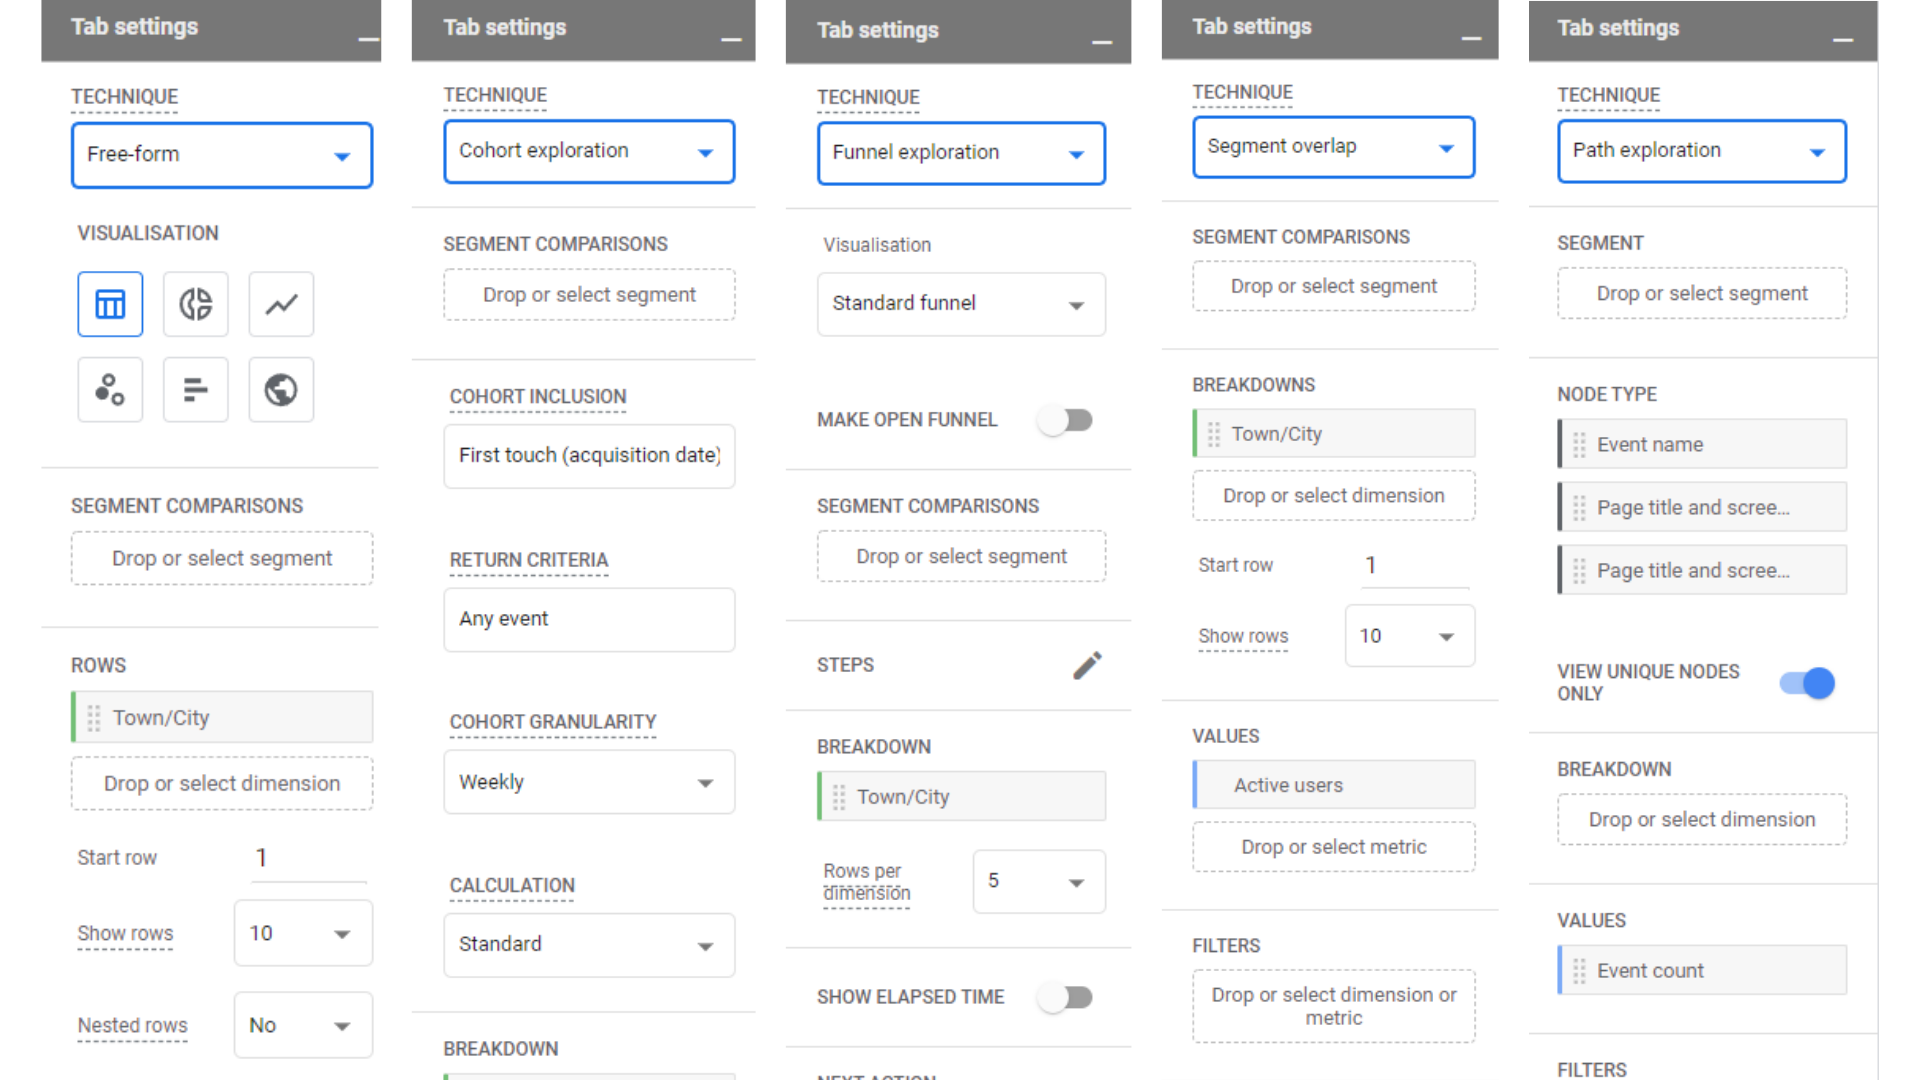 Tab settings
You can easily add a new tab by clicking the cross next to your existing tab, which will prompt you to select an exploration type.
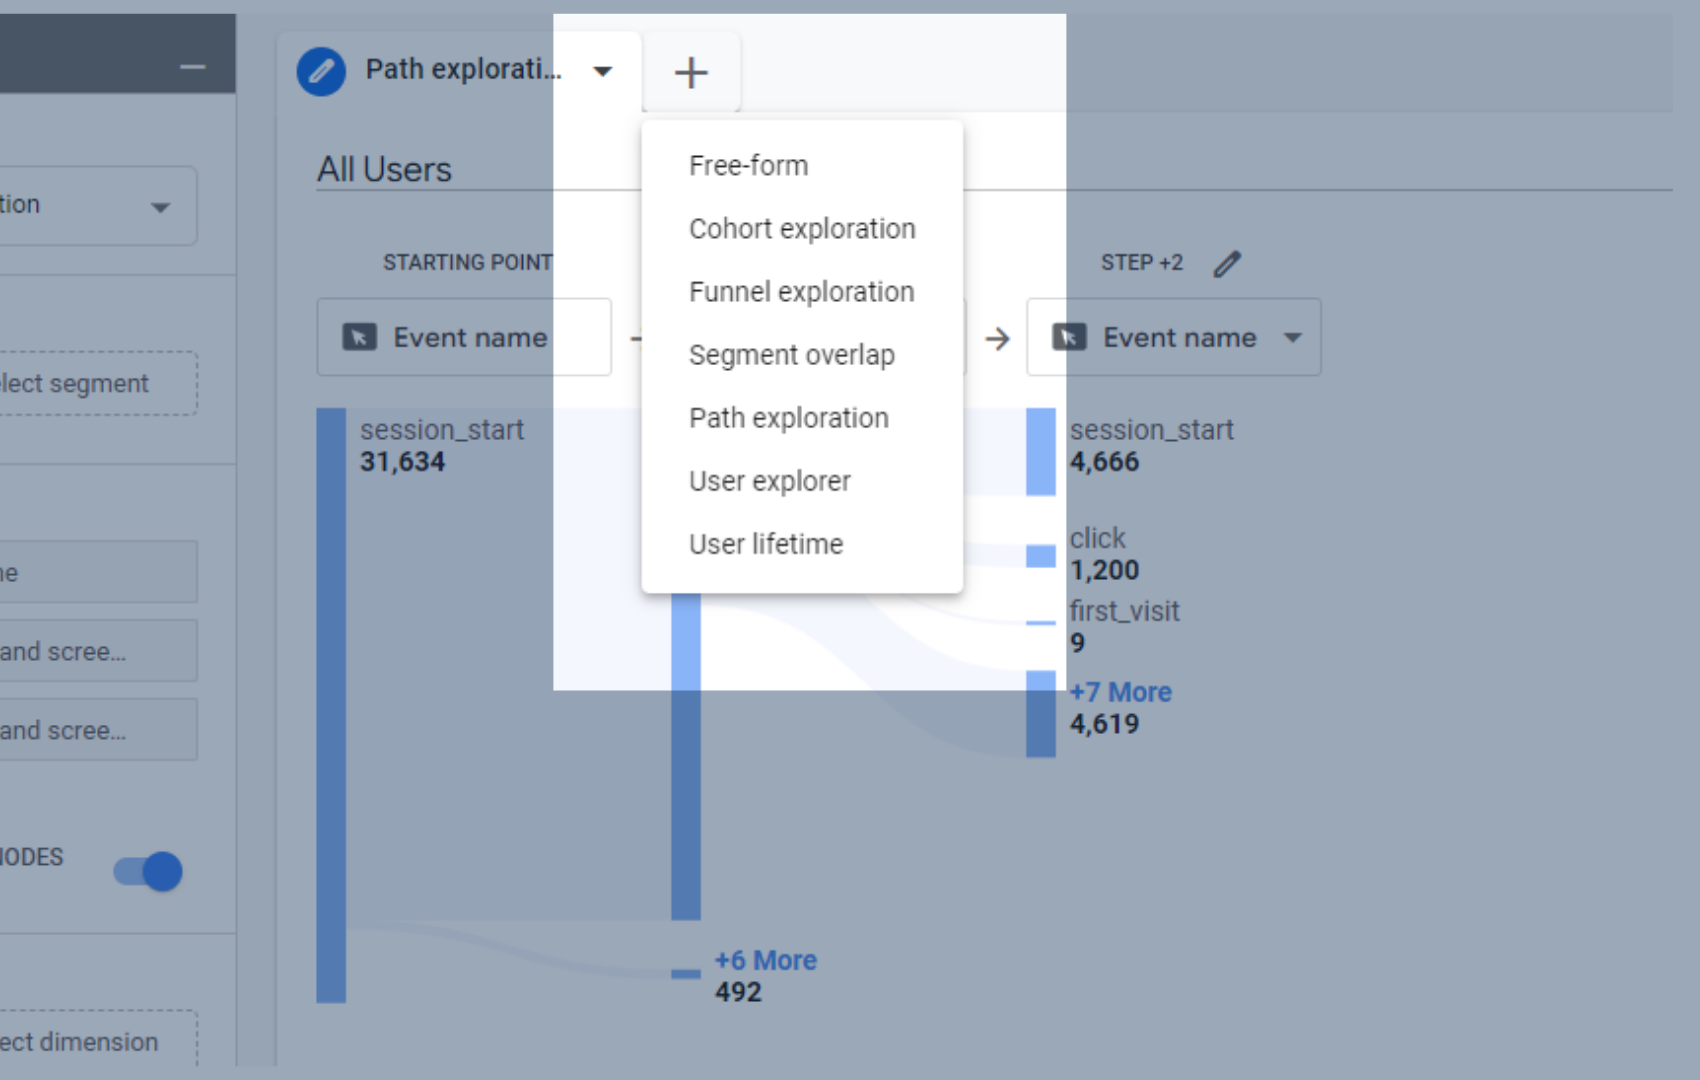
Add a new tab to your custom reports in GA4
Free-Form Explorations
Let’s create a free-form exploration report.
Free-form explorations are very similar to blank explorations, except they have some data already added as standard. This is useful for beginners, as it gives you an idea of which dimensions go where in the tab settings.

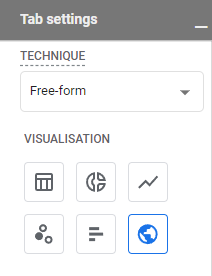
Visualisation options in free-form exploration
You can also play around with how you want your data to look in the report. You might think it looks good in a table, then realise a geo-map could be better.

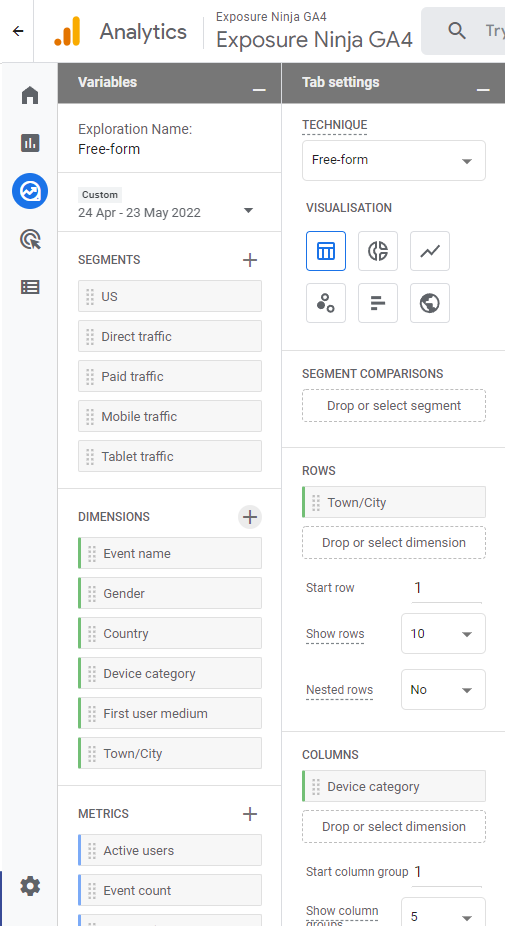
Free-form exploration standard data as a table
The data for the rows, town/city, is taken from the dimensions set of variables, as is the data for the columns, device category. The value, active users, is taken from the metrics section of the variables window.
You can change what appears here by dragging and dropping variables from the variable box into the tab settings box. You can remove them just as easily by clicking the X that appears when you hover over variables in the tab settings box.
All your variables are colour codes to help you see which sections of the tab settings they can be dragged and dropped to. If you try to drag dimensions (green) into a section only for metrics (blue) you are unable to place it there.
Segments can only be placed in the segments section of the tab settings box.
Dimensions can be placed in the rows and columns section.
Metrics can only be placed in the values section.
Right now this exploration is visualised as a table, but as it includes locations it could look good visualised as a geo-map. You need to be careful here, as changing to a different type of visualisation may remove some of the data.
A better idea here is to create a new tab for this geo map, and changing it to a geo map removes the device information, which will be annoying if you decide to change back to a table.
You can duplicate your existing tab, by clicking on the down arrow on the tab and selecting duplicate.

Duplicate your existing tab
Once you’ve duplicated it, select the geo-map icon in the tab settings box, and your data will become a geo-map.
Change your data to a geo-map

Geo-map in reports
You can change the names of your tabs by clicking next to the existing text and typing in the name you want to give it.
Once you’ve found a visualisation that you like, you can adjust the data to your linking.
We spotted that quite a lot of our visitors do not have a town/city allocated to them, resulting in a row with now town or city allocated to it. This could be due to how their browser is set up, as they may have location services turned off.
We can remove these users from this report by right clicking on the not set row, and then selecting “exclude selection”.

Exclude data from your reports
Funnel Exploration
Funnels in GA4 are similar to UA, except they are a lot more flexible. As mentioned above, reports in GA4 don’t require you to filter all your data, resulting in the loss of some data. Instead, you can apply funnels retroactively to data you already have.
We’ll use the Google Merchandise Store demo account for this, as funnel exploration reports are excellent for e-commerce stores.
The funnel we’re going to look at here is:
- Viewed any product
- Added to cart
- Begin checkout
- Purchase
To start, you want to head to the steps section of the tab settings.
Steps section of the tab settings in funnel exploration
There may already be some steps in here if you started your funnel from a template. You can easily remove these by hovering over them and clicking the X button.
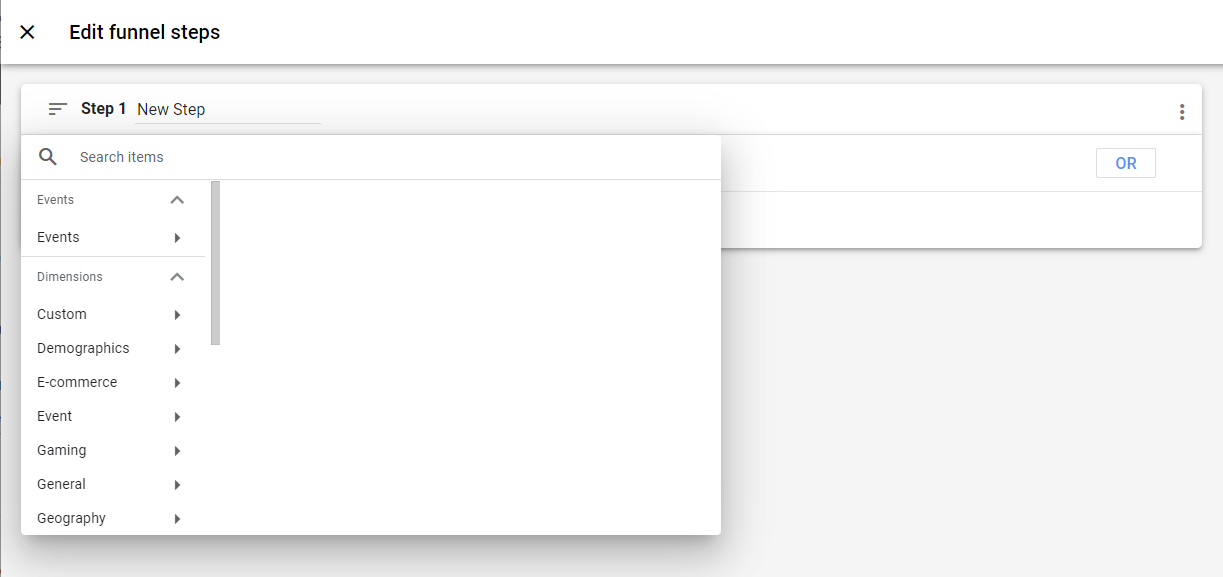
Click the pencil icon next to steps to edit the steps.

Edit funnel steps
We’re going to keep things very basic here as this is a beginners guide. We’ll be looking at singular “conditions” here – the steps that a user must take to be included in this funnel.
When you click “add new condition”, you’ll be greeted with a dropdown menu. For our first step we’ll be selecting the event “view_item”. This is when a user views an item in any capacity on the website, such as seeing it in a menu or list, not just seeing the product page.
You can either use the drop down menu to look for the condition, or type it in the search bar if you know the name of it.
You can also name your steps so that you know the exact purpose of each one.
Add a new condition to your funnel steps
The next step we want to add is “add to cart”.
There are quite a few customisable elements here – do you only want to track people who then added a product to their cart within 10 minutes of browsing products on the website? Then you can do that.
Do you only want to track users who completed step two directly after step one? You can also do that.

Customise funnel steps
Keep adding steps until you have each step that you want in your funnel. To save them, click the blue “Apply” button in the top right corner of the screen.

Funnel with steps added
While you’re working on your funnel steps, you’ll be able to see how many users make it to the bottom of the funnel. This is a good tool for seeing if your funnel is worth tracking.
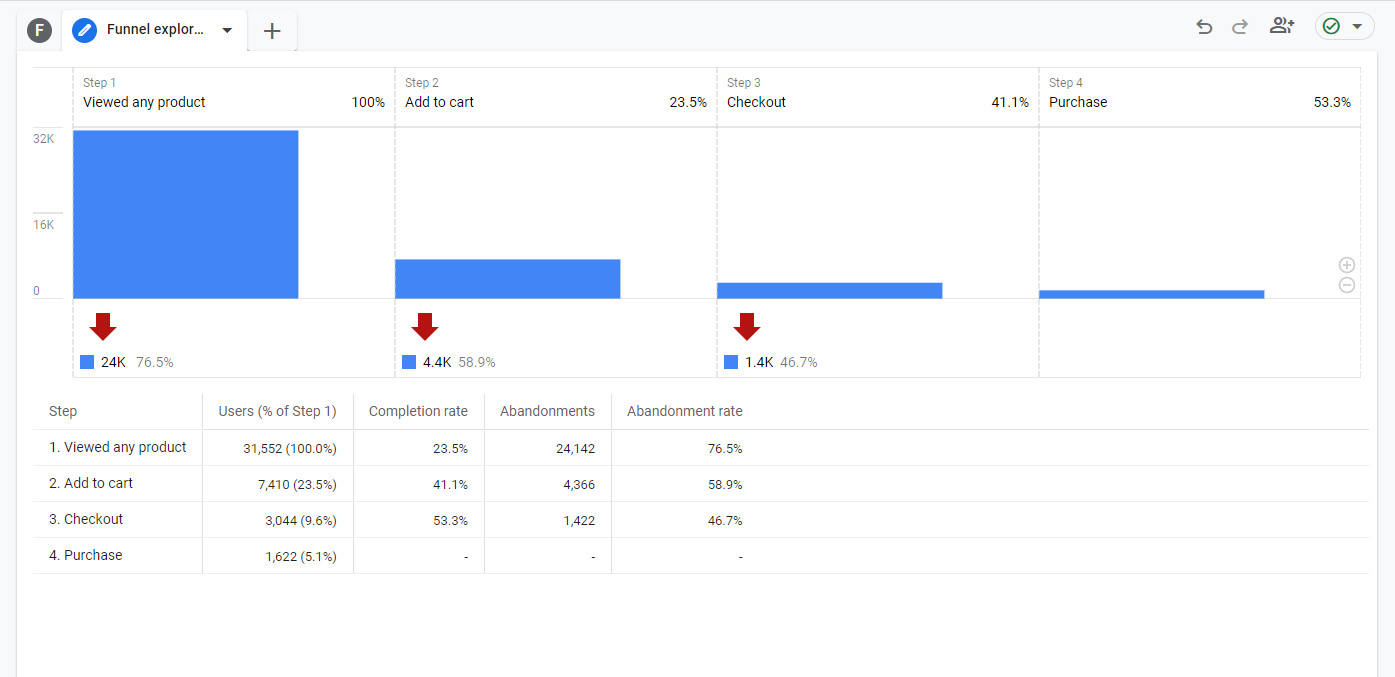
Standard sales funnel visualisation
You can then use this to see where people are leaving the funnel. We can see from this data that 23.5% of users added a product to their cart after viewing, but only 5.1% checked out. Could there be an issue on the checkout page that’s turning people away?
You can also create segments from these users. So let’s say you want to retarget shopping cart abandoners with PPC ads, you can create that segment directly from this funnel.
Right click on the checkout row in the table and select “create segment from abandonments”. Now you have a whole new segment of data to play with that you can use to up your conversions.
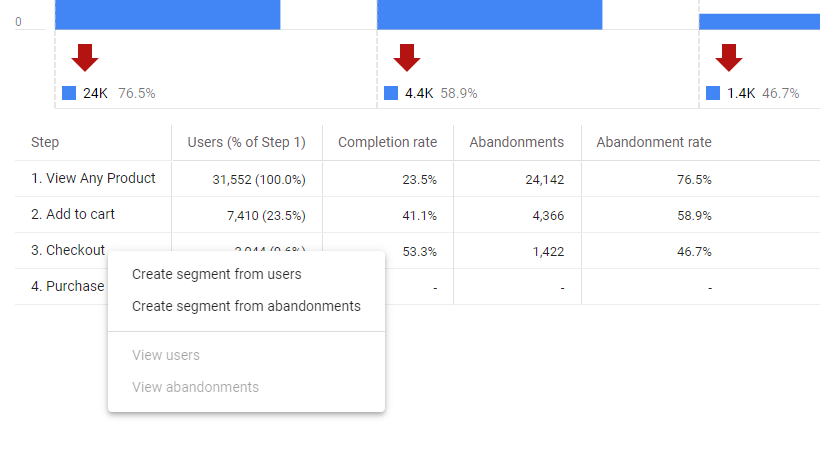
Create a segment of shopping cart abandoners
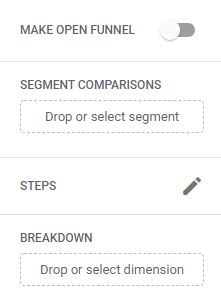
We’re just sticking to the basics for now, but there are lots of settings you can play around with in the tab settings box to get a funnel that suits your needs, such as making the funnel open, adding segments to compare how different audiences behave in the same funnel, or tracking the next action your users take after this funnel has been completed.
It’s also great for seeing where there may be friction in the funnel. For example, if lots of users are dropping out at the checkout page, it could be that your checkout is too complex.
Path Exploration
Path explorations are great for seeing how users travel through your website. This is similar to flow reports in UA, but you have more flexibility.
You can start your paths at the end goal, rather than the starting point, to see which steps your users take before reaching a certain page or converting.
We’re going to use the ending point to see the most common path to purchase on the Google Analytics 4 Demo account.
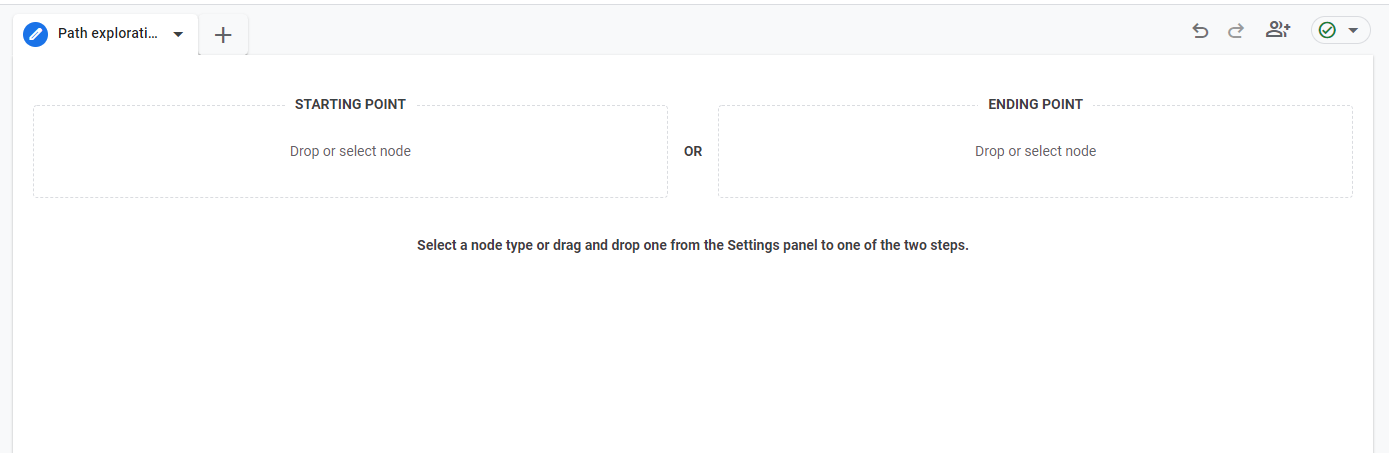
Choose from starting point or ending point for your path exploration
You can either pull your ending point “node” cross from the variables or tab settings, or you can select it directly from the ending point box. Just click in the box and select the event name or page title / screen name you want as your final destination.

Search for your ending point in path exploration
Once you’ve chosen an ending point, you can then work backwards to see the path your users took to get there. You can see your options visually in Step-1. We’ll be following through the page view section of the path just to give us the most interesting path for this guide.
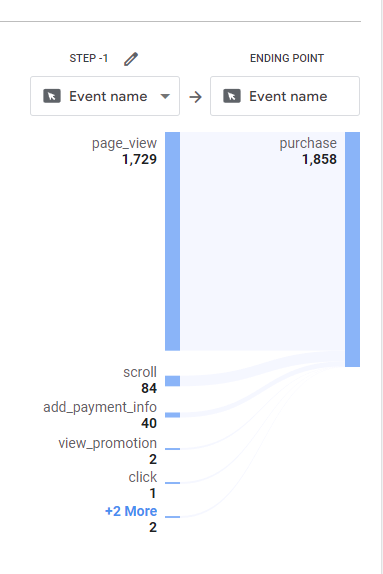
Select your path
Click on the text, or the blue bar next to the text on the path you want to explore – in our case, it’s the page_view section.
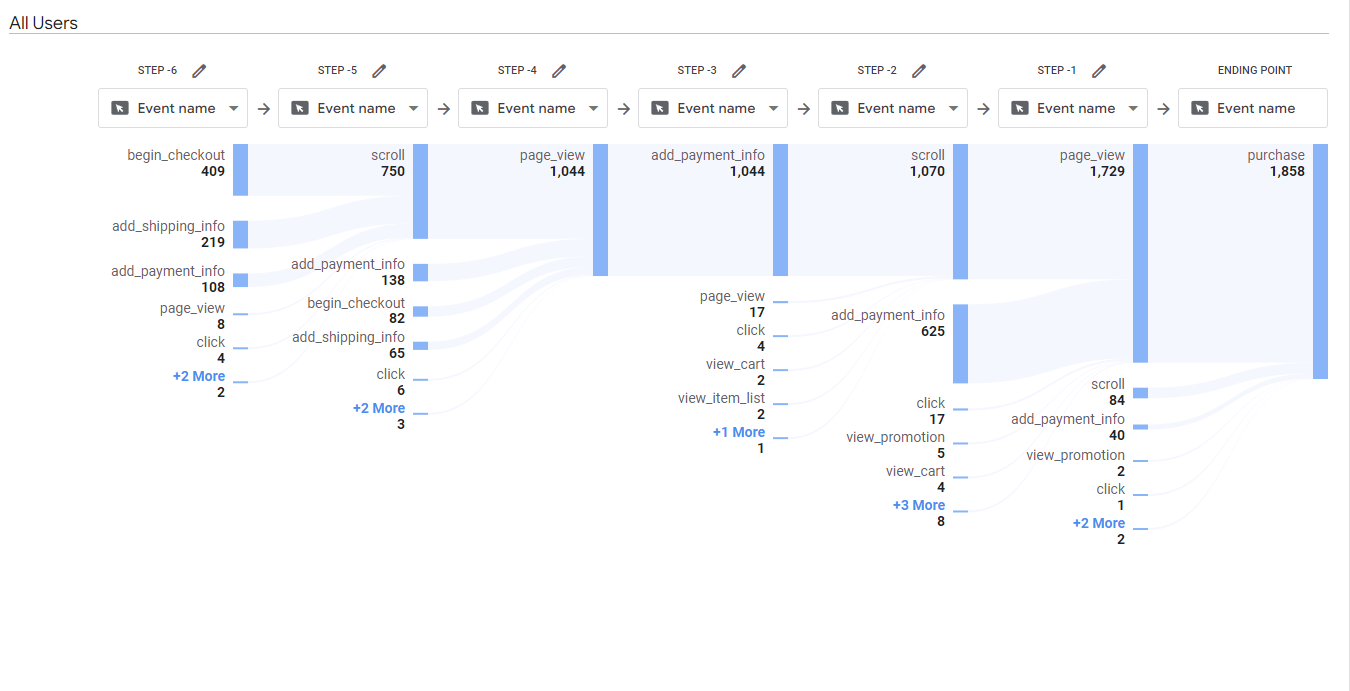
Six step path to purchase report
Now that we’ve extended this path out, we can get an idea of the main path that our users follow before purchasing.
As with previous examples, it’s crucial that you get hands on with reports to understand them fully.
If you want to learn even more ways to use custom reports, check out this video
Is your marketing underperforming?
Request a free website and marketing review and our team will tell you how to improve your marketing.
Segments in Google Analytics 4
Segments let you slice your data so you can analyse subsets of data. You could use this to compare elements of the user experience on mobile and desktop, for example.
This is different to segments in UA, which have now been replaced by comparisons in GA4.
So let’s say at Thinkplus, we wanted to compare website and marketing review form submissions between the UK and the USA, and how that varies on mobile and desktop devices, we could do so using segments.
How to create segments in GA4
Segment creation takes place in the exploration reports we covered above.
We’ve created a free-form exploration report which shows us event name and device category.

Free-form GA4 report with no segmentation
To narrow this down to just the free_website_review event, we right clicked on free_website_review and selected “include only section”, so we can just look at the data we want to see.
Right now, we are looking at data from all users, so let’s use segments to compare the US and UK.
We already have a segment for US traffic set up by GA4, so we can easily drag that into the segments box, or double click it to add that to our exploration.
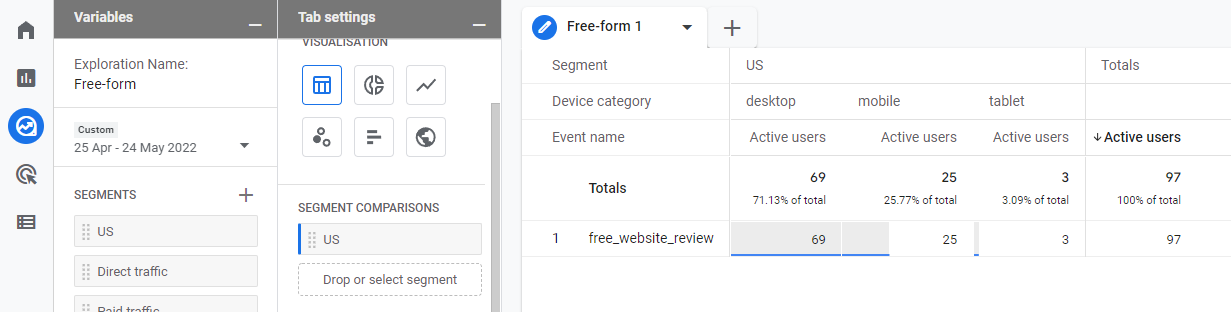
Free-form exploration report segmented by US
We don’t have a segment for the UK, so we’ll need to set that up manually.
Start by clicking on the cross button next to segments in the variables tab. Here, you will need to select the type of segment you are creating. For this example, we’ll be using the user segment. There are also some suggested segments if you’re not sure which types of segments you’d like to use and want to test some out to see how they affect the data.
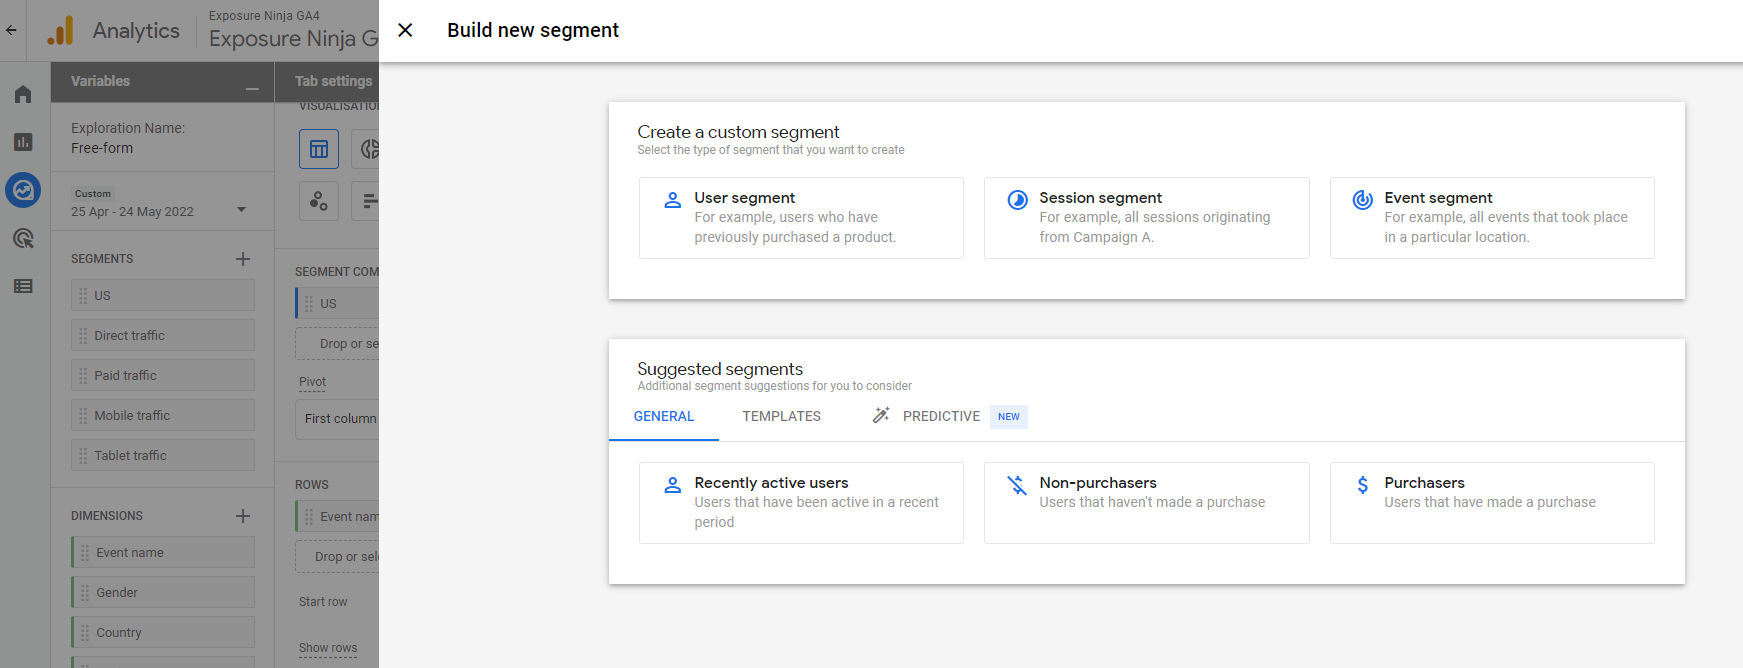
Build a new segment
Select the type of segment you want to create, and then start filling out the data you want to collect. Make sure you give your segment a name, as this is what will show up in the segment area in the variables tab, and you want to be able to find it easily.
When creating segments you can choose to include or exclude data. We’ll be including users from the UK.

Select your data’s segment
Click the down arrow next to Add new condition and select the data you want to segment. For us, that means going to geography and selecting country ID, then adding a filter to exactly match GB. It’s important to check the country code, as here GA4 goes with GB for Great Britain rather than UK for the United Kingdom.

Country ID exactly matches GB
Once you click apply, you’ll be able to see how many users will be in this segment. This is handy if you’re not sure if there are enough users in a segment to do a comparison.
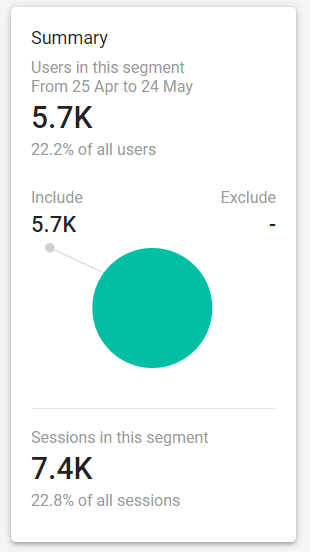
Number of users in the segment
Once you click save and apply, your segment will be saved and automatically applied to your current exploration report.
This segment will only exist in the current report you are using, so if you want to use it in a different report you’ll have to create it from scratch.
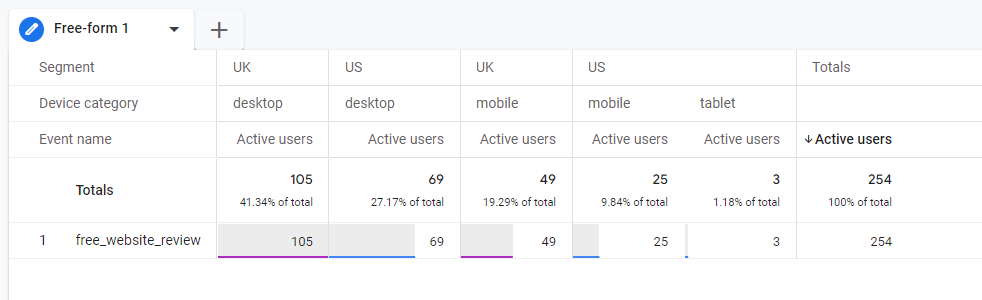
Report segmented by US and UK
Now you have these segments, you can change what is included in the rows and columns to suit your liking.
This video explains how to create different types of segments in GA4.
A summary of the changes in Google Analytics 4
Let’s summarise Google Analytics 4.
This is a bit tough, due how many changes are coming with GA4 and how much is new, or how much you might feel like you’re losing.
The main thing to remember is that this isn’t a bad thing. After using Universal Analytics for years, it can feel overwhelming to see this many changes in one update. It can feel like the rug is being pulled from under you, but we promise it isn’t.
We’ve released this guide soon enough that you can start learning how to use GA4 now, rather than leaving it till Google forces you to make the change. It’s so important that you start using GA4, and start collecting data from your site so that when the change happens you won’t feel like you’re starting all over again learning Google Analytics.
It will be a much smoother transition, we promise.
Of course, feeling nostalgic for Universal Analytics will be a common feeling for lots of people. But, trust us when we say, Google Analytics 4 isn’t as bad as you think.
Google Analytics 4 Loses
- No views
- No / limited IP filtering
- Missing reports that need to be set up manually
- Limits on custom dimensions
- No recurring email reports
Google Analytics 4 Wins
- Simplified data which is more accessible to users and the Google algorithm
- Better tracking across website and apps
- Codeless event tracking
- Custom reports
- AI-powered insights and predictions
- Advanced audience integration with Google Ads
- More focus on customer lifecycle-framed reporting
As a last note, we will keep this guide updated whenever there are new changes to GA4, but on occasion some screenshots may look slightly different to what you experience when you’re looking at your own GA4 property due to it still being in development.